Fig. 4
Download original image
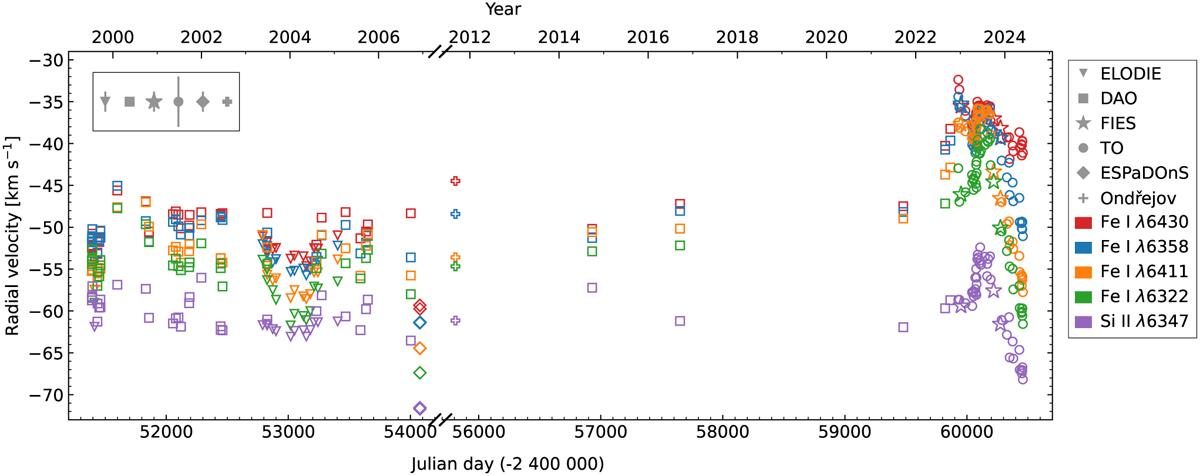
Mean core velocities of four representative Fe I lines and a Si II line. The full timeline covers the years from the beginning of the 2000s until mid-2024. We note that there is a gap in the x-axis. Different symbols mark data from different spectrographs (mean error bars for each instrument are given in the top-left corner). The colours red, blue, orange, and green correspond to Fe I λλ6430,6358,6411, and 6322 lines respectively, and purple corresponds to Si II λ6347. A detailed look at each individual Fe I line during the dimming event is given in Appendix C.1.
Current usage metrics show cumulative count of Article Views (full-text article views including HTML views, PDF and ePub downloads, according to the available data) and Abstracts Views on Vision4Press platform.
Data correspond to usage on the plateform after 2015. The current usage metrics is available 48-96 hours after online publication and is updated daily on week days.
Initial download of the metrics may take a while.