Fig. 3
Download original image
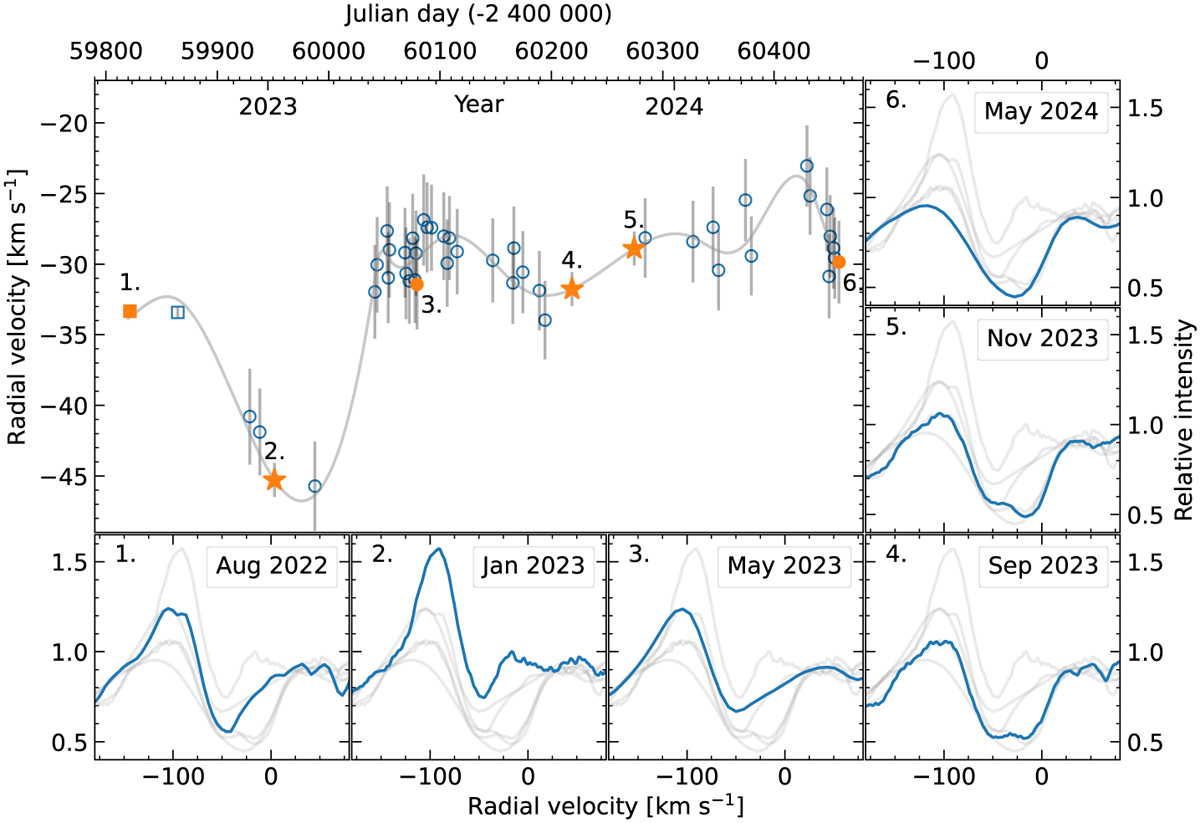
Variability of the radial velocity and Hα line profile during the Great Dimming. The main panel showcases the radial velocity variability, and the small numbered panels around it correspond to spectral line profiles on dates highlighted and numbered on the radial velocity curve of the main panel. Behind the highlighted line, all other five profiles are drawn in light grey, to provide a point of reference. Panel nr. 1 is from before the dimming minimum, but the emission is already visible. Panel nr. 2 showcases the profile when the star was faintest. The following panels, 3–6, were taken when the star was already brightening and the strength of the emission in Hα decreased. In the later period, the variability in radial velocity was caused mostly due to the variable profile of the absorption component rather than the strong emission influence (compare panels 4 and 5). Panels 2, 4, and 5 are FIES spectra; panel 1 is from DAO; and panels 3 and 6 are TO spectra. The lower resolution of panels 3 and 6 results in a smoother profile shape. We note that the systemic velocity of the star has not been subtracted from the velocity axis.
Current usage metrics show cumulative count of Article Views (full-text article views including HTML views, PDF and ePub downloads, according to the available data) and Abstracts Views on Vision4Press platform.
Data correspond to usage on the plateform after 2015. The current usage metrics is available 48-96 hours after online publication and is updated daily on week days.
Initial download of the metrics may take a while.