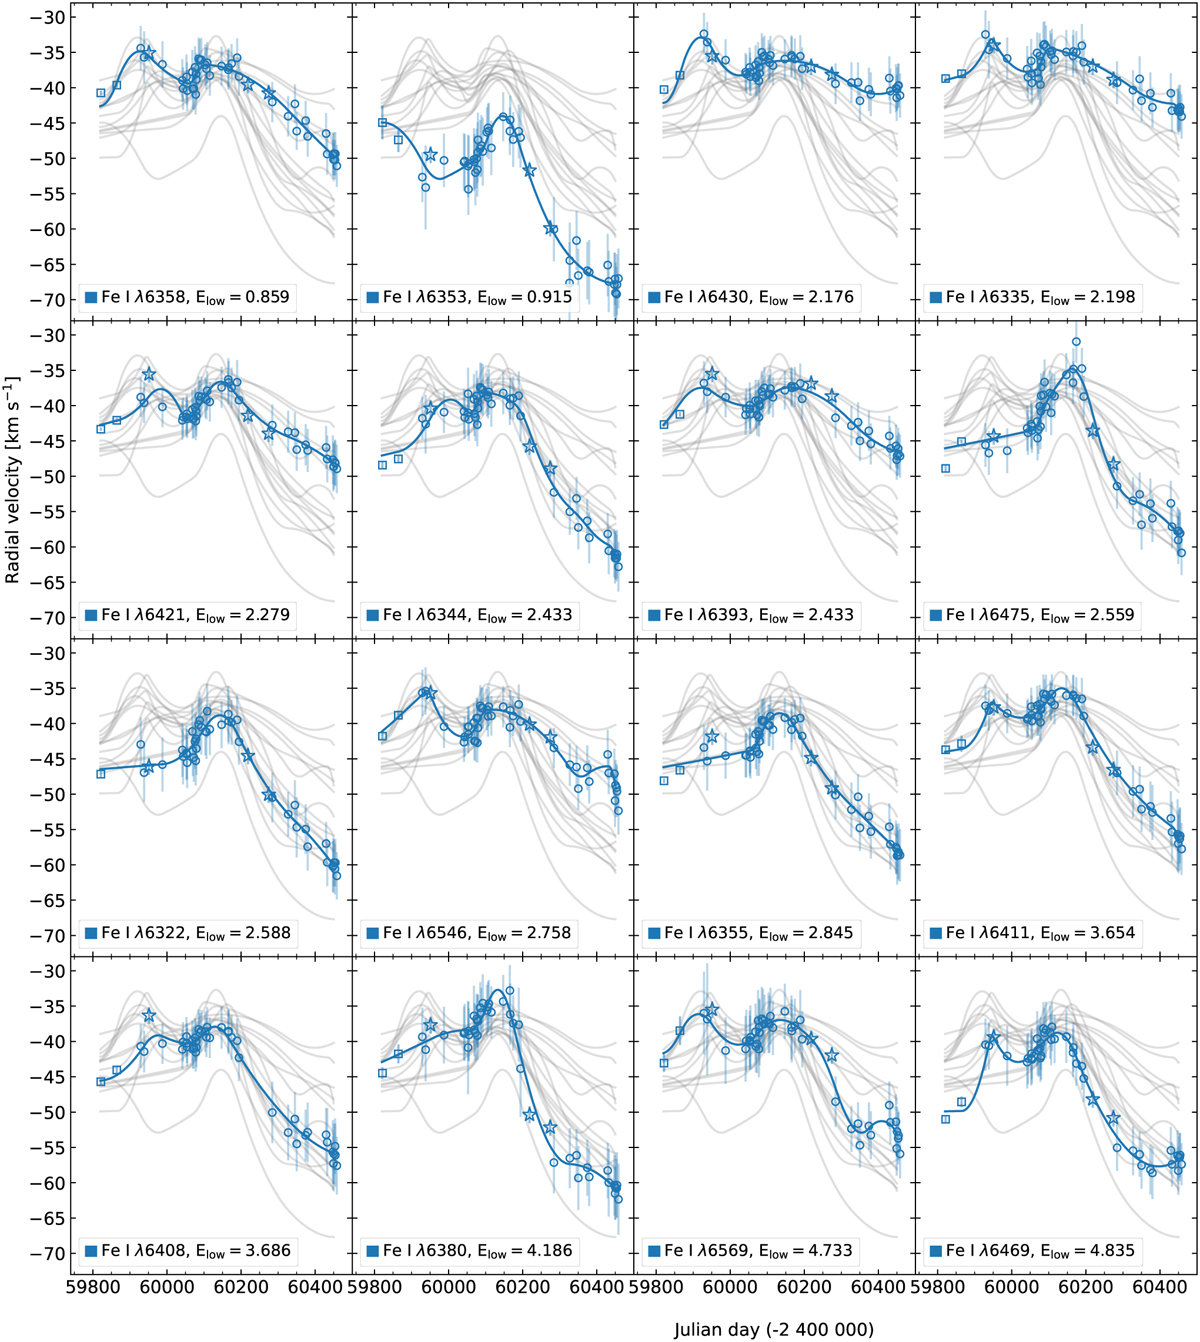
Fig. C.1
Download original image
Radial velocity of 13 Fe I lines during the Great Dimming episode. Each of the 13 panels highlights a different spectral line with the measured radial velocity data including uncertainties and a smooth trend line, the grey curves in the backround provide a point of reference towards the other lines. The shapes of the data points are the same as in the previous figures: square for DAO, star for FIES, and circle for TO. The uncertainties of FIES and DAO data are smaller than the markers. The uncertainties of TO data are more significant (we estimate an additional error of ~ 2.5 km s−1 not included in this plot). However, spectra taken in subsequent or nearby nights show good concurrence and also there is good match with FIES data.
Current usage metrics show cumulative count of Article Views (full-text article views including HTML views, PDF and ePub downloads, according to the available data) and Abstracts Views on Vision4Press platform.
Data correspond to usage on the plateform after 2015. The current usage metrics is available 48-96 hours after online publication and is updated daily on week days.
Initial download of the metrics may take a while.