Fig. B.1
Download original image
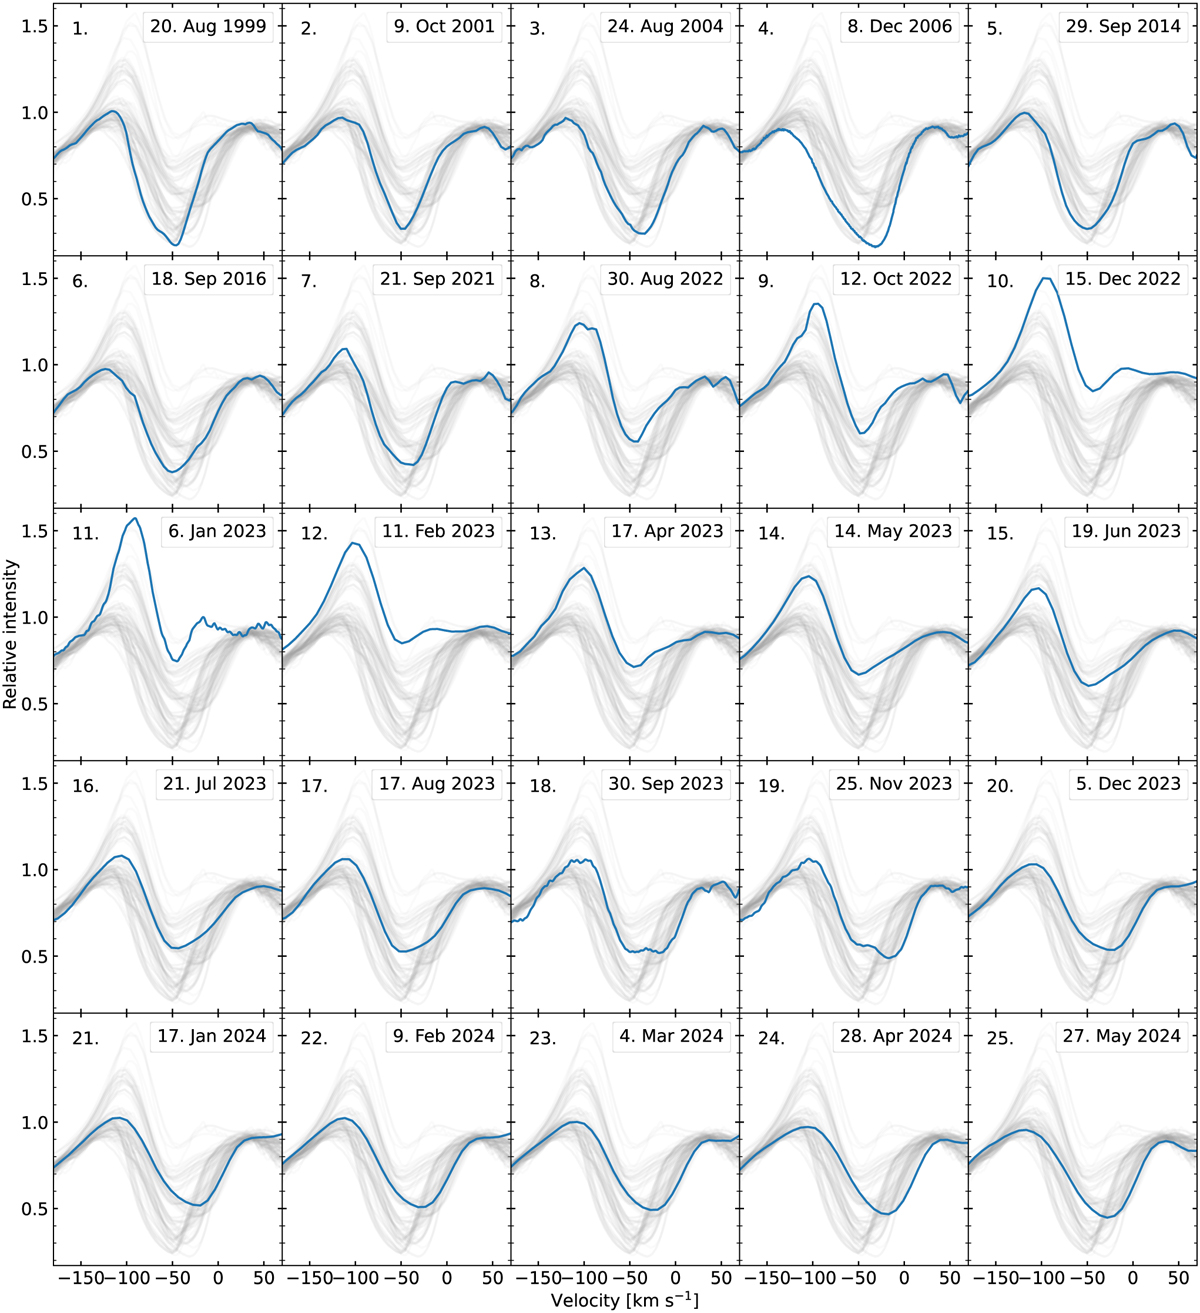
Selected line profiles to illustrate the variability of the Hα profile before and during the Great Dimming. We note that the systemic velocity has not been subtracted from the velocity axis. Individual dates are highlighted in blue and the thin grey lines in the background are all spectral profiles from all observation epochs, shown for comparison purposes. All observations are detailed in Appendix D.1. The spectra seem to form a couple of visually distinct ’groups’; however, this is a side-effect of the uneven temporal coverage. Panels nr 1–6: Hα line profile during the normal variability behaviour of the star. Panels 7–9: RW Cep is entering the dimming minimum, brightness is decreasing. Panels 10–11: Spectra taken during the dimming minimum, 15th December spectrum is from TO and has a lower resolution, and 6th Jan is a high-resolution FIES spectrum. Panels 11–25: Post-dimming minimum evolution of the Hα line. Spectra from dates Sept 2023 and Nov 2023 are from FIES, which reveal the finer structure in the Hα line, rest of them are from TO.
Current usage metrics show cumulative count of Article Views (full-text article views including HTML views, PDF and ePub downloads, according to the available data) and Abstracts Views on Vision4Press platform.
Data correspond to usage on the plateform after 2015. The current usage metrics is available 48-96 hours after online publication and is updated daily on week days.
Initial download of the metrics may take a while.