Fig. 13

Download original image
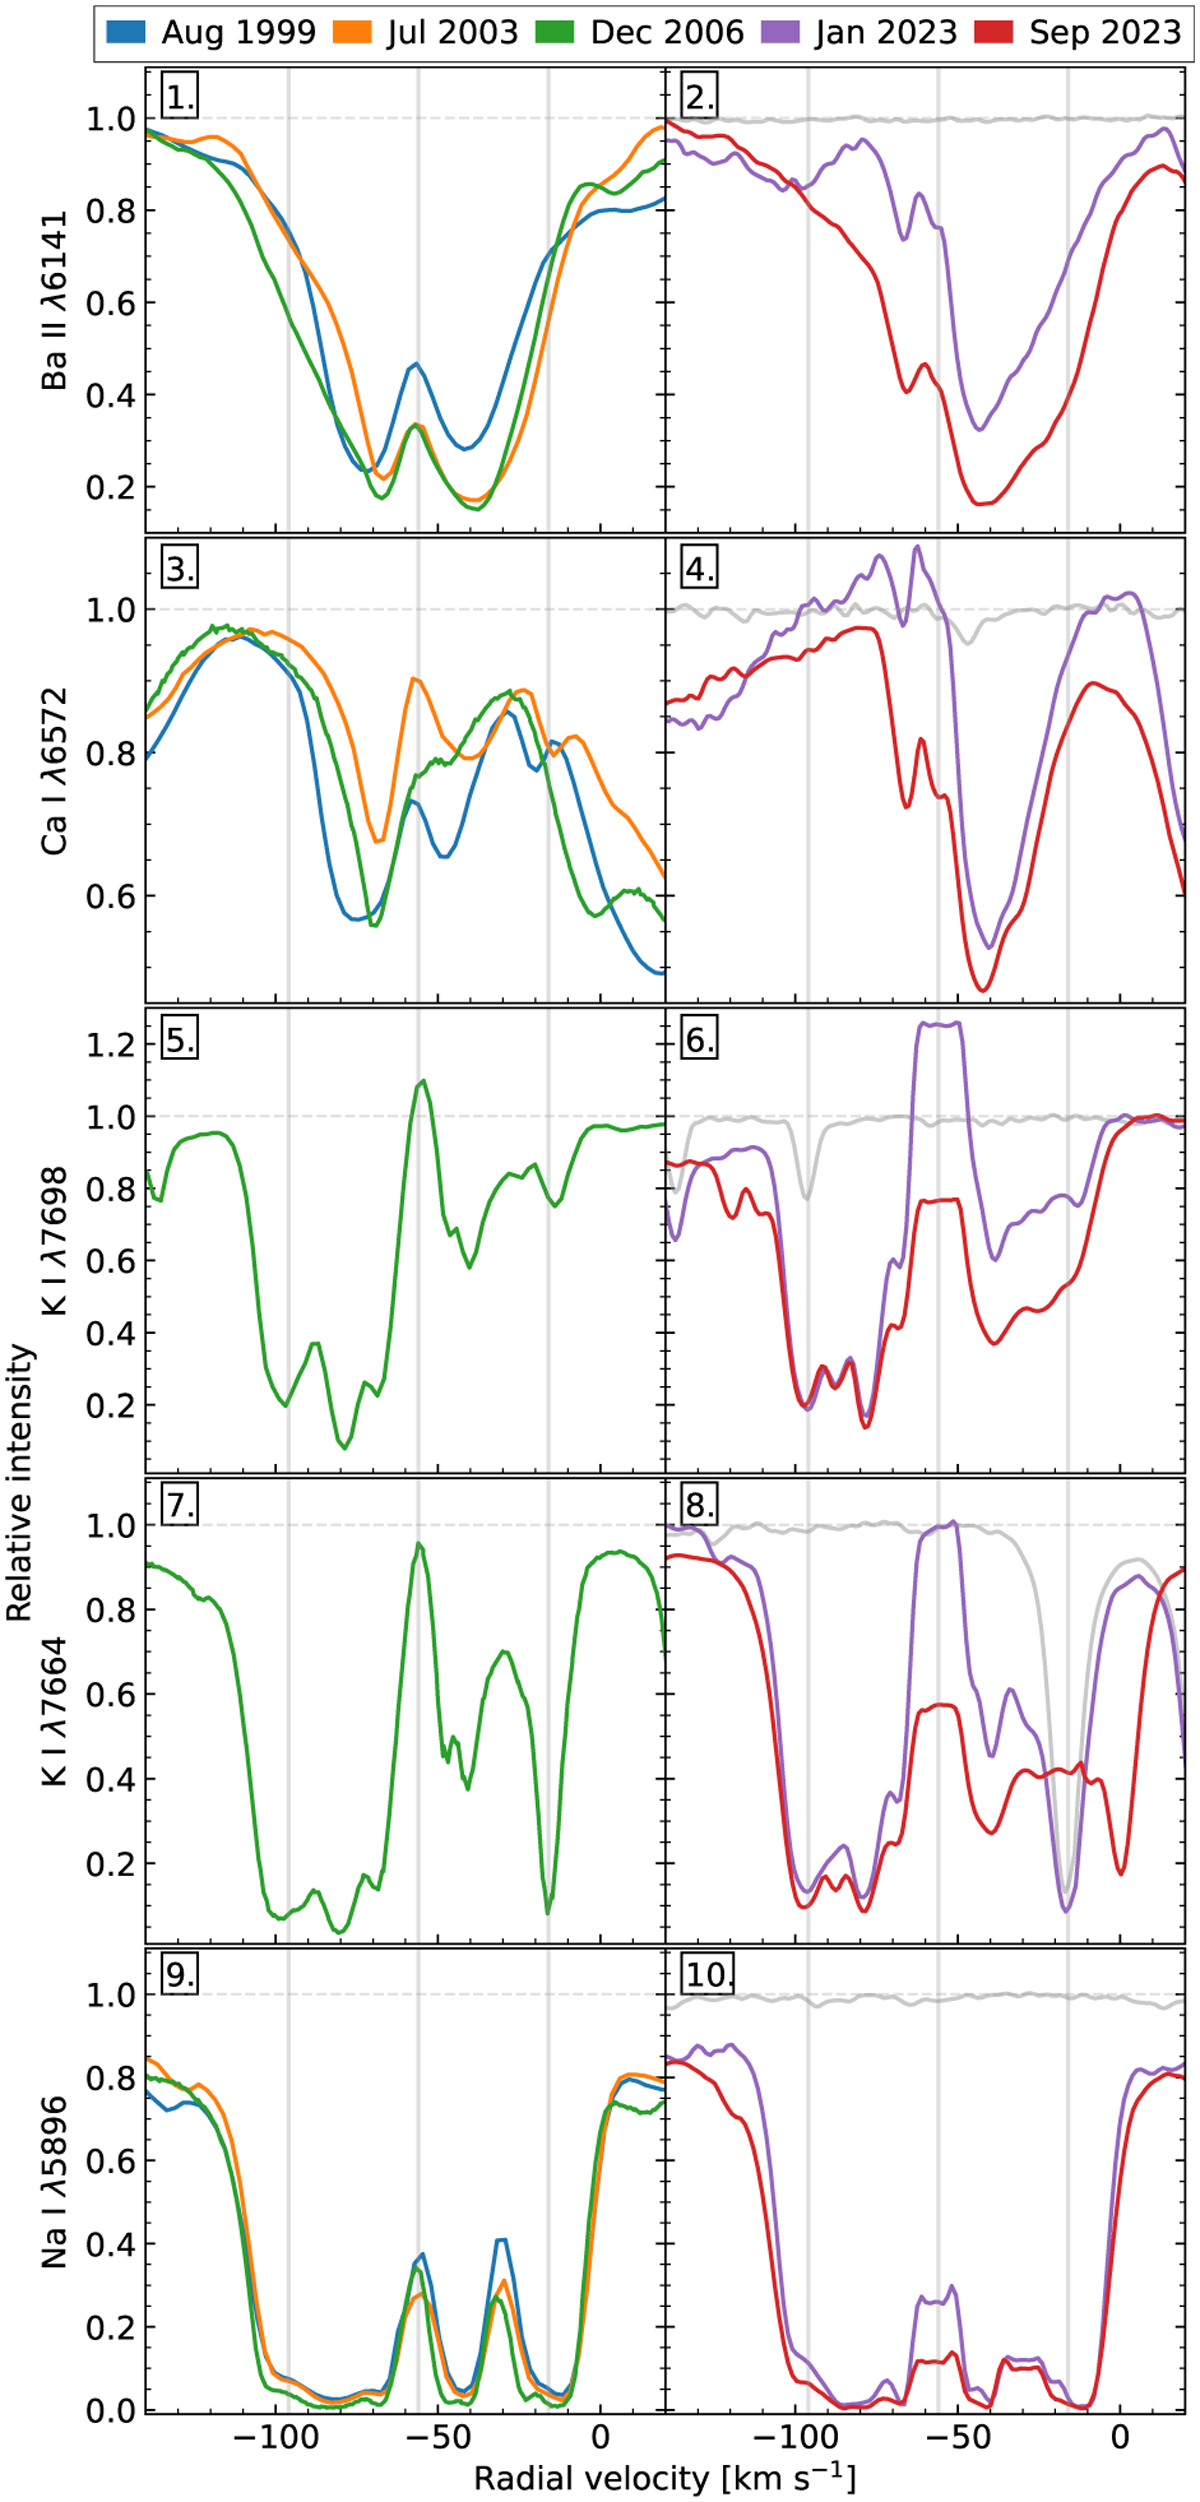
Selection of resonance lines in the spectrum of RW Cep. Rows from top to bottom: Ba II λ6141.71, Ca I λ6572.78, K I doublet λλ7698.96, 7664.91, and Na I D2 λ5895.92. Odd-numbered panels show the line profiles in August 1999 (blue, ELODIE), July 2003 (orange, ELODIE), and December 2006 (green, ESPaDOnS) and even- numbered panels show the profiles during the Great Dimming minimum in January 2023 (purple, FIES) and 9 months later in September 2023 (red, FIES). Additionally, a telluric standard spectrum from the same January 2023 night has been included (light grey) to display the locations of blending telluric lines, especially in K I. For the K I only ESPaDOnS and FIES spectra are displayed due to the limited spectral range of ELODIE. Grey vertical lines trace the location of the emission peak at –56 km s−1 and also at ±40 km s−1 from it to help guide the eye.
Current usage metrics show cumulative count of Article Views (full-text article views including HTML views, PDF and ePub downloads, according to the available data) and Abstracts Views on Vision4Press platform.
Data correspond to usage on the plateform after 2015. The current usage metrics is available 48-96 hours after online publication and is updated daily on week days.
Initial download of the metrics may take a while.


