Open Access
Fig. 12
Download original image
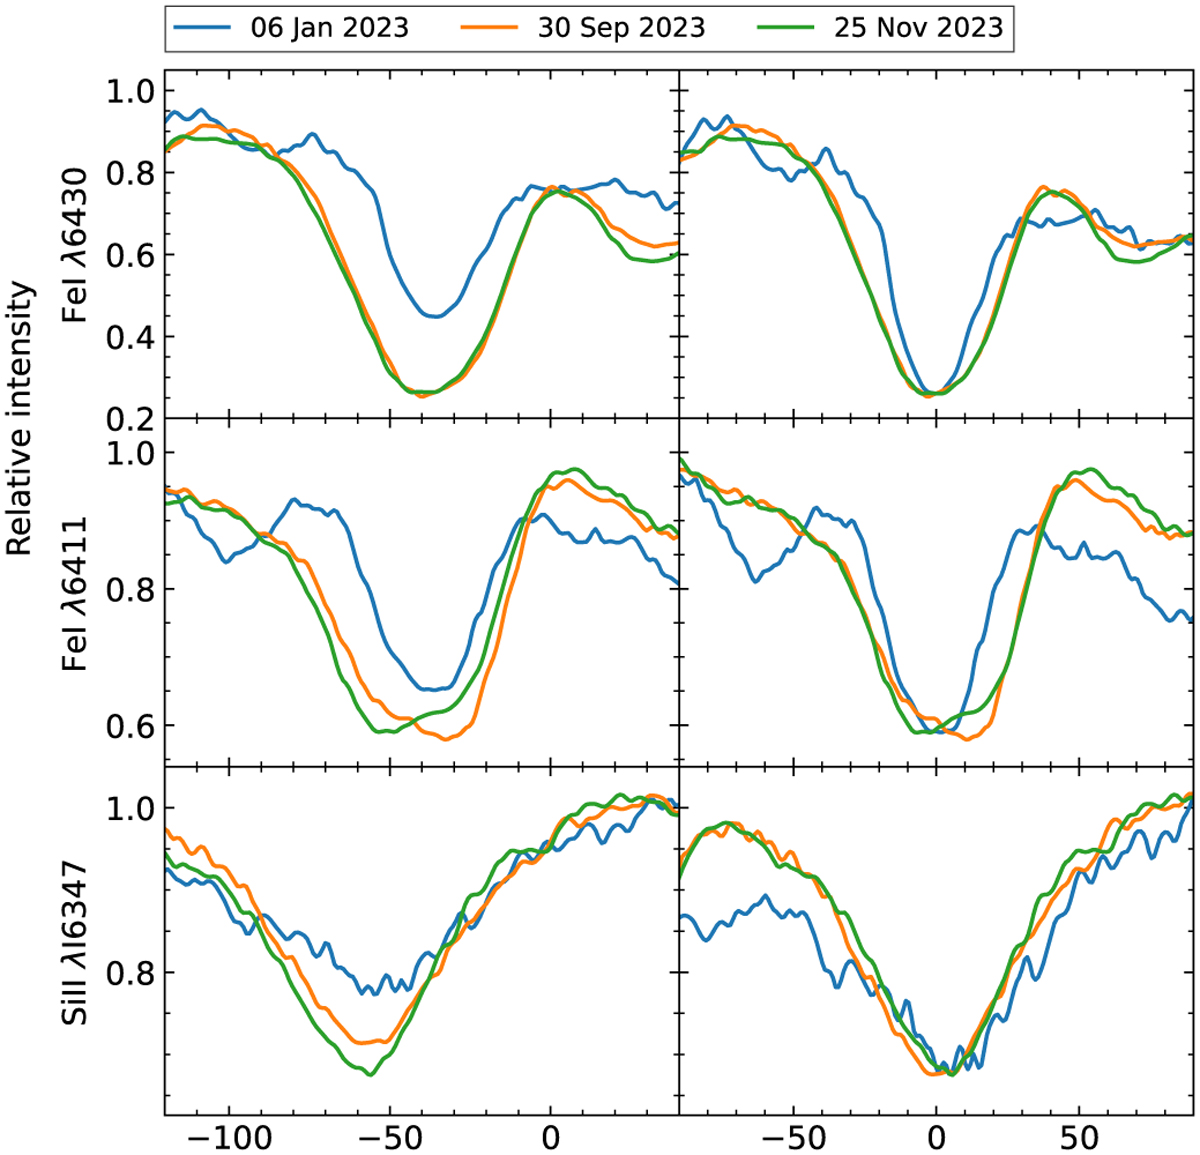
Same as Fig. 11 but with addition of the Si II line. We have plotted FIES spectra on three dates. The January spectrum (blue) was taken during the dimming minimum, and the other two were taken nine months (orange) and 11 months (green) later, when the brightness had returned to a near-normal level.
Current usage metrics show cumulative count of Article Views (full-text article views including HTML views, PDF and ePub downloads, according to the available data) and Abstracts Views on Vision4Press platform.
Data correspond to usage on the plateform after 2015. The current usage metrics is available 48-96 hours after online publication and is updated daily on week days.
Initial download of the metrics may take a while.