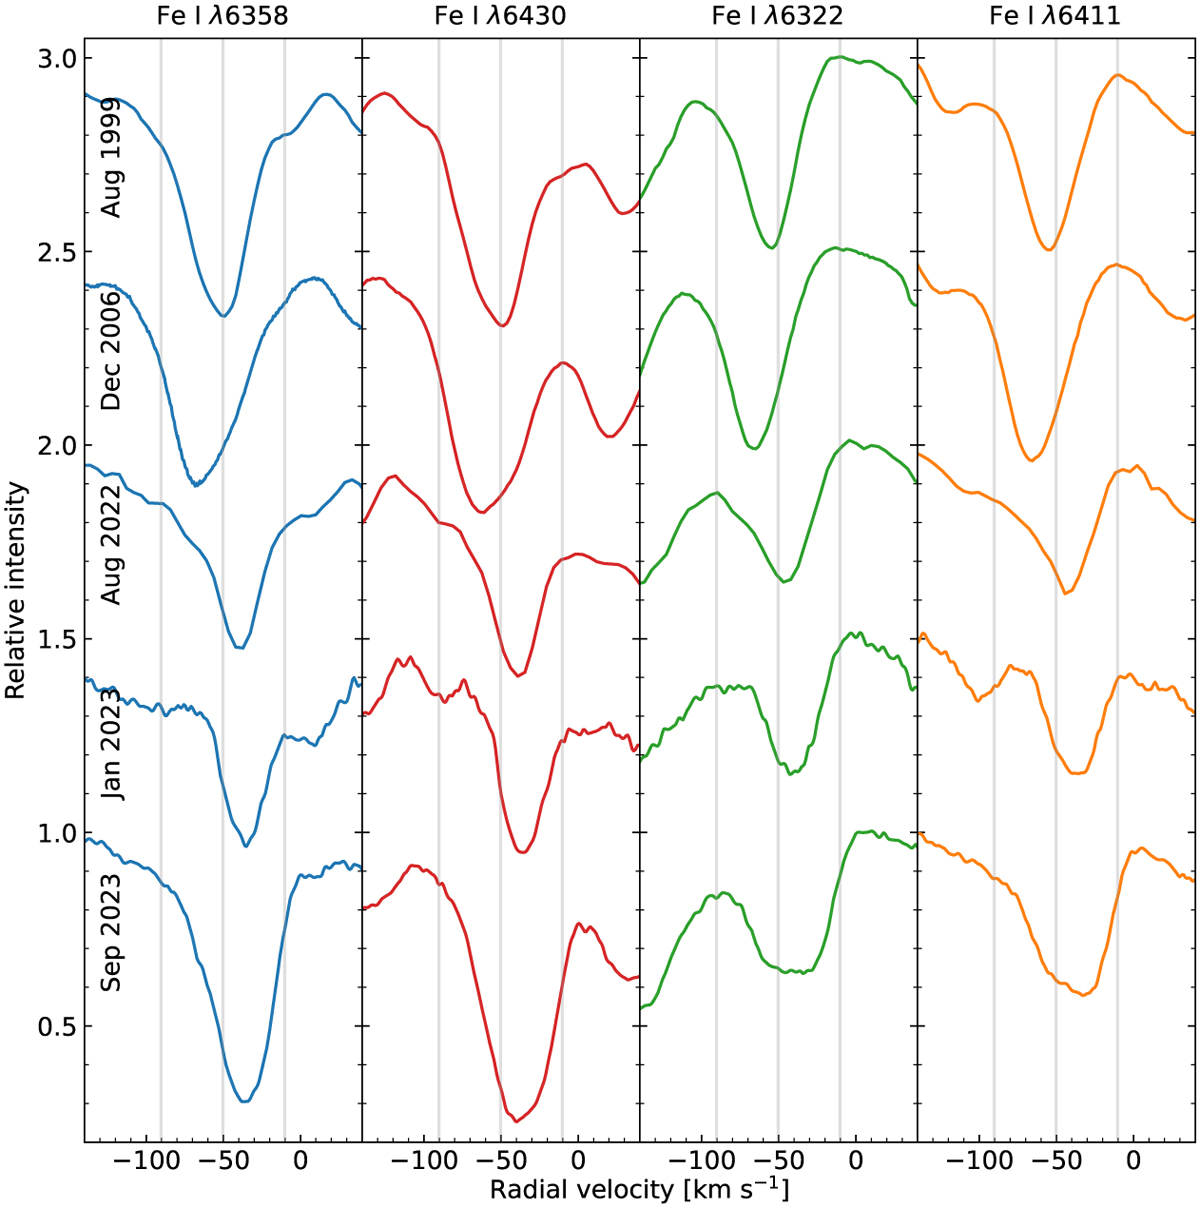
Fig. 10
Download original image
Comparison of four Fe I lines (columns) on different epochs (rows) before and during the Great Dimming. The λλ6358, 6430 lines represent the strong Fe I lines and the λλ6322, 6411 represent the weak Fe I lines. The colours of the lines correspond to the colours in Fig. 4. The central thin grey line traces the υsys and two additional lines are drawn at ±40 km s−1 to guide the eye. The spectra are from ELODIE (August 1999), ESPaDOnS (December 2006), DAO (August 2022), and FIES (January and September 2023) The first two spectra from 1999 and 2006 characterise the line properties during the calm state of the star. The August 2022 and January 2023 show the spectra during the Great Dimming and illustrate the effects of the added blue-shifted emission. The added emission shifts the absorption to higher velocities and decreases the line strength and width. The September 2023 spectrum shows the post-dimming behaviour of the lines. The strong lines return to near their normal strength while remaining at higher velocities. The weaker lines gain a significantly wider line profile and remain shallower, but their radial velocity returns to near pre-dimming levels.
Current usage metrics show cumulative count of Article Views (full-text article views including HTML views, PDF and ePub downloads, according to the available data) and Abstracts Views on Vision4Press platform.
Data correspond to usage on the plateform after 2015. The current usage metrics is available 48-96 hours after online publication and is updated daily on week days.
Initial download of the metrics may take a while.