Fig. 1
Download original image
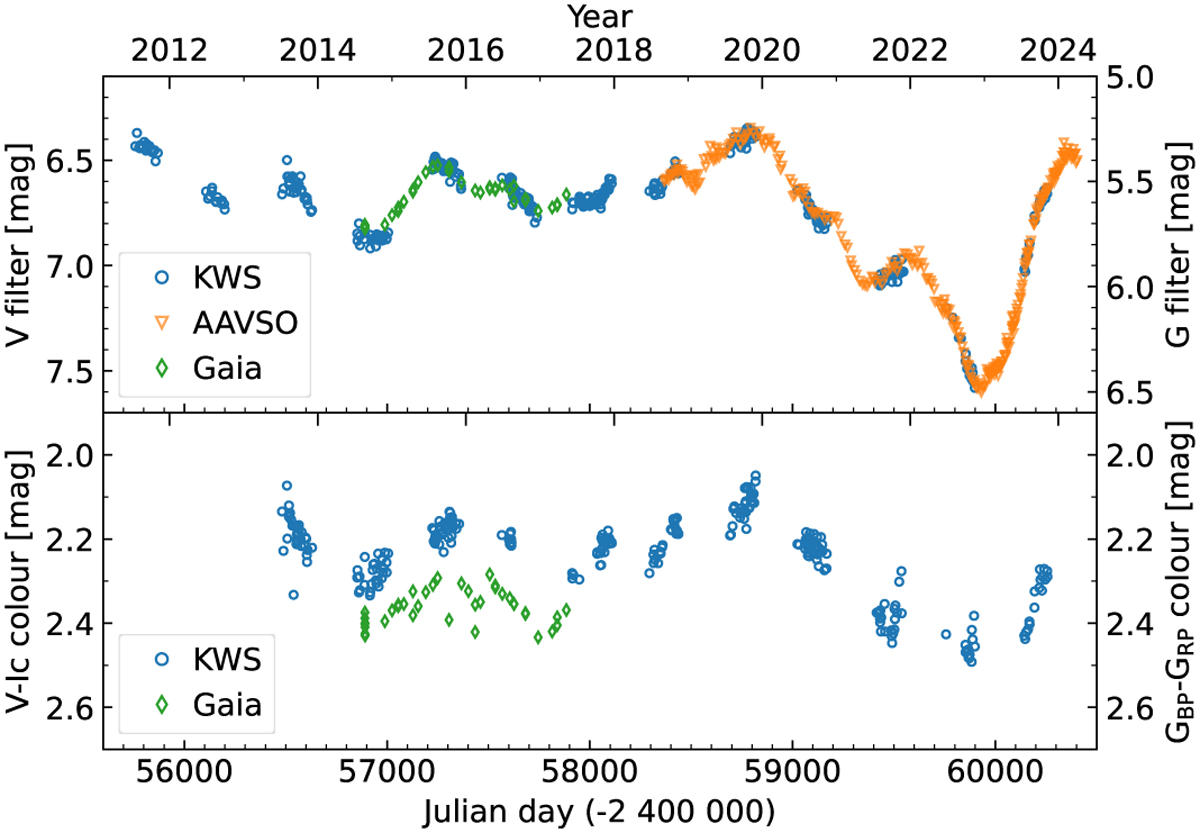
Photometric data. Upper panel: V-filter light curve from AAVSO and KWS data, including G-filter data from Gaia. Lower panel: (V-Ic) colour together with (GBP -GRP) colour from Gaia. Each point corresponds to one night. The uncertainties are smaller than the data points. We note that the y-axes for Gaia data are on the right of the figure, but the scale unit sizes are the same for both V -filter and Gaia data. However, the axis limits for V filter and Gaia are different in the upper panel.
Current usage metrics show cumulative count of Article Views (full-text article views including HTML views, PDF and ePub downloads, according to the available data) and Abstracts Views on Vision4Press platform.
Data correspond to usage on the plateform after 2015. The current usage metrics is available 48-96 hours after online publication and is updated daily on week days.
Initial download of the metrics may take a while.