Fig. 8
Download original image
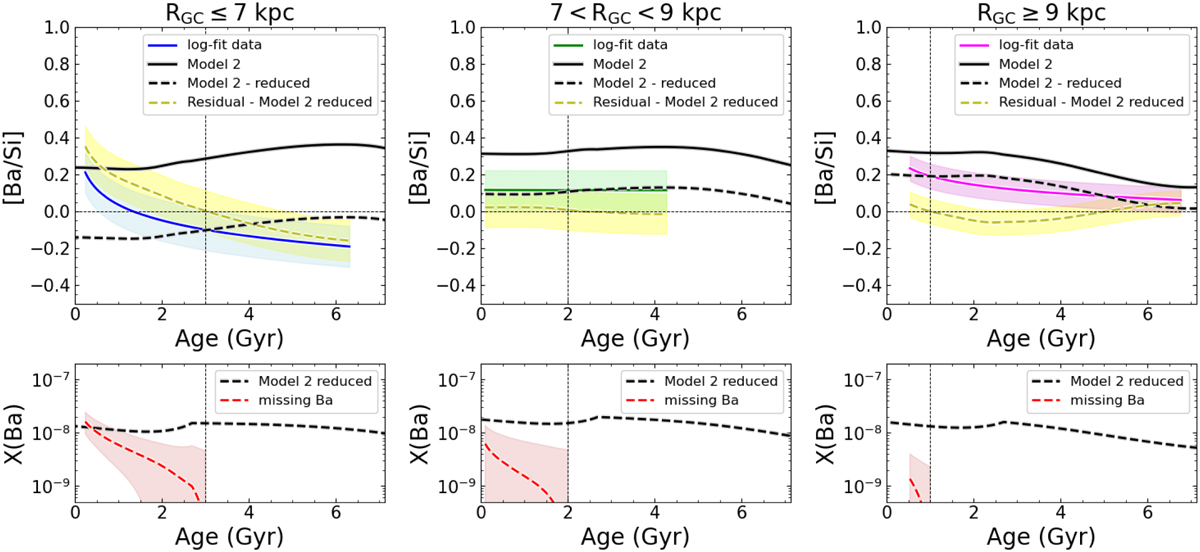
Upper panels: [Ba/Si] versus age trend in the inner, solar, and outer regions. The observational data trend is represented by the logarithmic fit with the associated 1σ error bar curve. The result of Model 2 is shown by the black line. The dashed black and yellow lines represent Model 2 with reduced s-process production and its associated residual curve. Bottom panel: absolute abundance of Ba as predicted by the reduced Model 2 (dashed black line) together with the computed missing abundance of Ba in the age ranges of interest (see text for details).
Current usage metrics show cumulative count of Article Views (full-text article views including HTML views, PDF and ePub downloads, according to the available data) and Abstracts Views on Vision4Press platform.
Data correspond to usage on the plateform after 2015. The current usage metrics is available 48-96 hours after online publication and is updated daily on week days.
Initial download of the metrics may take a while.