Fig. A.1.
Download original image
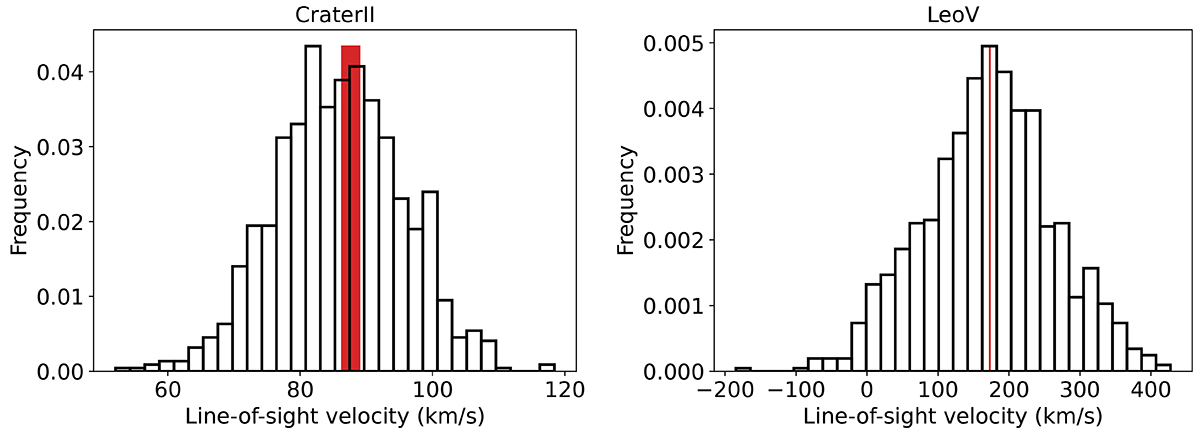
Distributions of line-of-sight velocities from Monte Carlo sampling for the two Milky Way satellite galaxies Crater II (left panel) and Leo V (right panel). The red bands give the range from sampling the measured line-of-sight velocities. The black histograms show the resulting line-of-sight velocities if errors are sampled in 6D Cartesian coordinates independently, ignoring their mutual correlations.
Current usage metrics show cumulative count of Article Views (full-text article views including HTML views, PDF and ePub downloads, according to the available data) and Abstracts Views on Vision4Press platform.
Data correspond to usage on the plateform after 2015. The current usage metrics is available 48-96 hours after online publication and is updated daily on week days.
Initial download of the metrics may take a while.