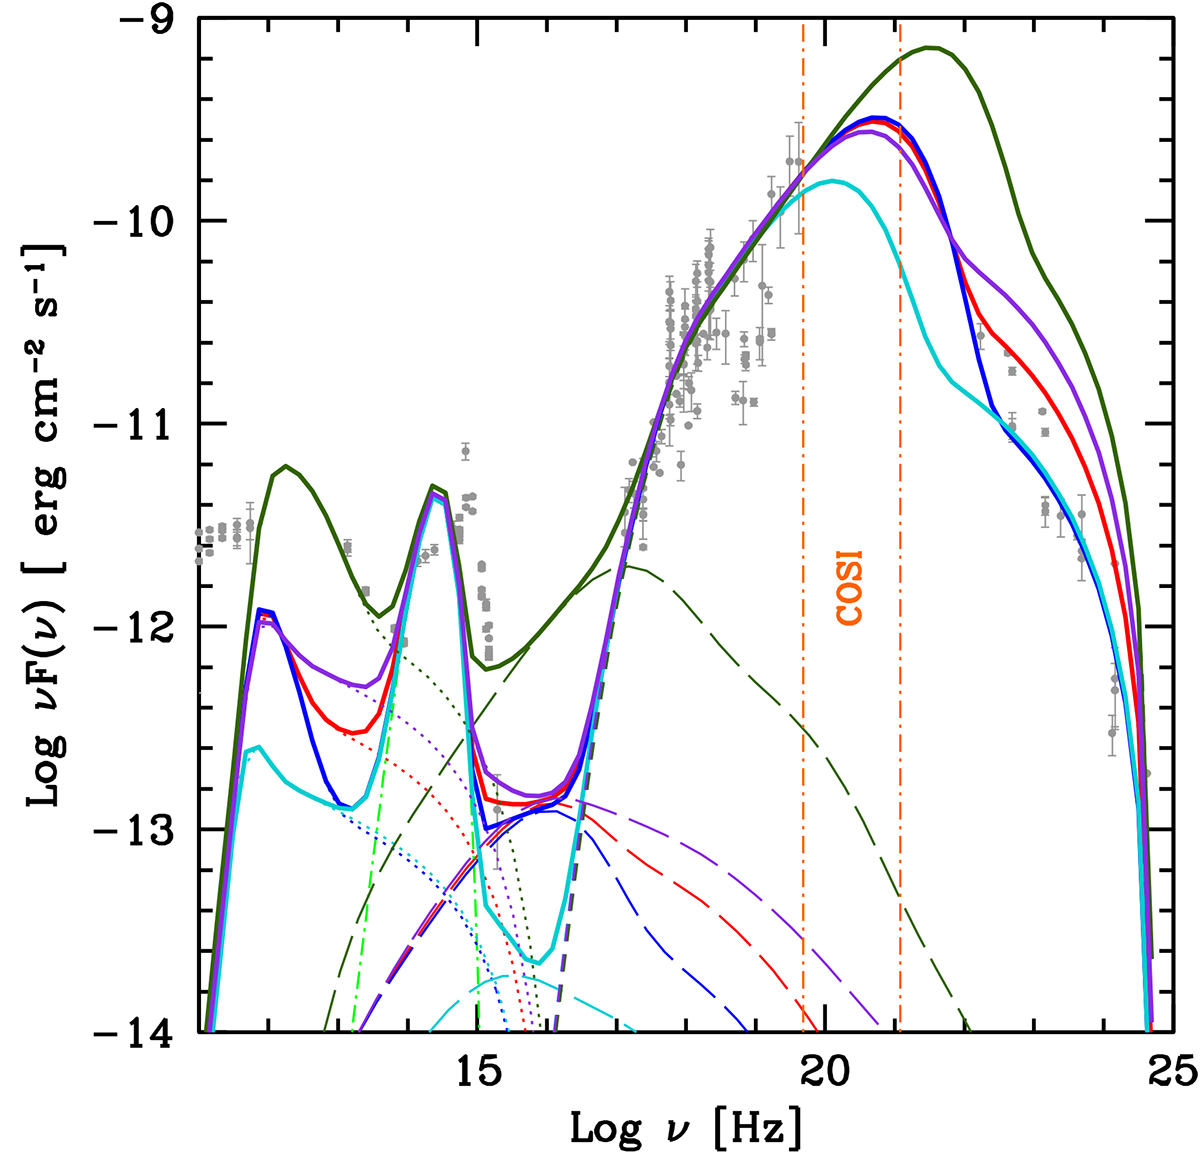
Fig. 2.
Download original image
SED calculated with the model described in the text. The colors indicate the following: model A (red), B (blue), C (light blue), D (green), and E (violet). The dash-dotted light green line shows the contribution from the accretion disk. We also report the contribution from the synchrotron (dotted), SSC (long-dashed), and EC (short-dashed). The vertical orange lines show the COSI energy band. For reference, in gray we also show the observational data points of the FSRQ 0836+710 (z = 2.1) from ASI-SSDC.
Current usage metrics show cumulative count of Article Views (full-text article views including HTML views, PDF and ePub downloads, according to the available data) and Abstracts Views on Vision4Press platform.
Data correspond to usage on the plateform after 2015. The current usage metrics is available 48-96 hours after online publication and is updated daily on week days.
Initial download of the metrics may take a while.