Fig. 9.
Download original image
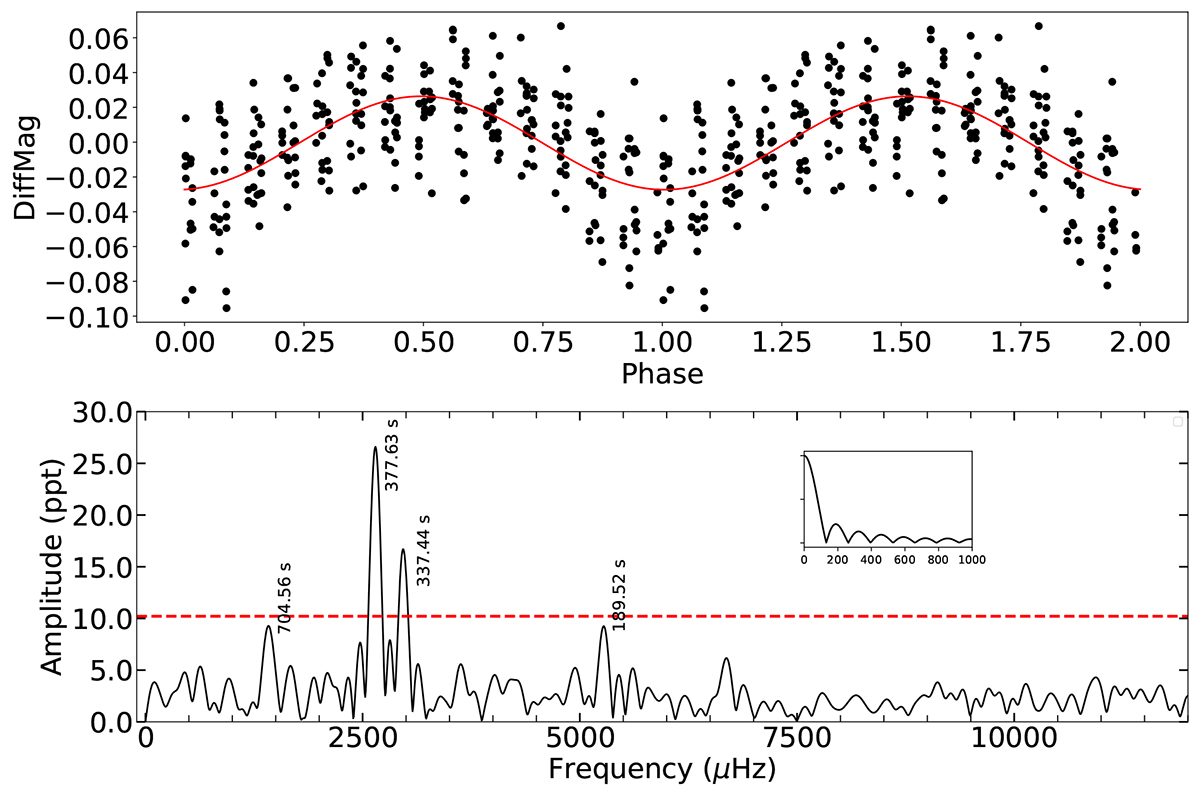
Light Curve and Fourier Transform of SDSS J090559.60+084324.9. Top: Phased-folded light curve for the new ZZ Ceti SDSS J090559.60+084324.9. The light curve was folded to the highest-amplitude pulsational period of about P = 377 s. The solid red line indicates a sinusoidal fit, depicted for a better visualisation of the variation. The ‘lined’ appearance in the folded light curve is attributed to the 337 s pulsation period being close to an alias of the cadence. Bottom: FT for the same star. The horizontal dashed red line indicates our detection limit, and the spectral window is depicted as an inset plot.
Current usage metrics show cumulative count of Article Views (full-text article views including HTML views, PDF and ePub downloads, according to the available data) and Abstracts Views on Vision4Press platform.
Data correspond to usage on the plateform after 2015. The current usage metrics is available 48-96 hours after online publication and is updated daily on week days.
Initial download of the metrics may take a while.