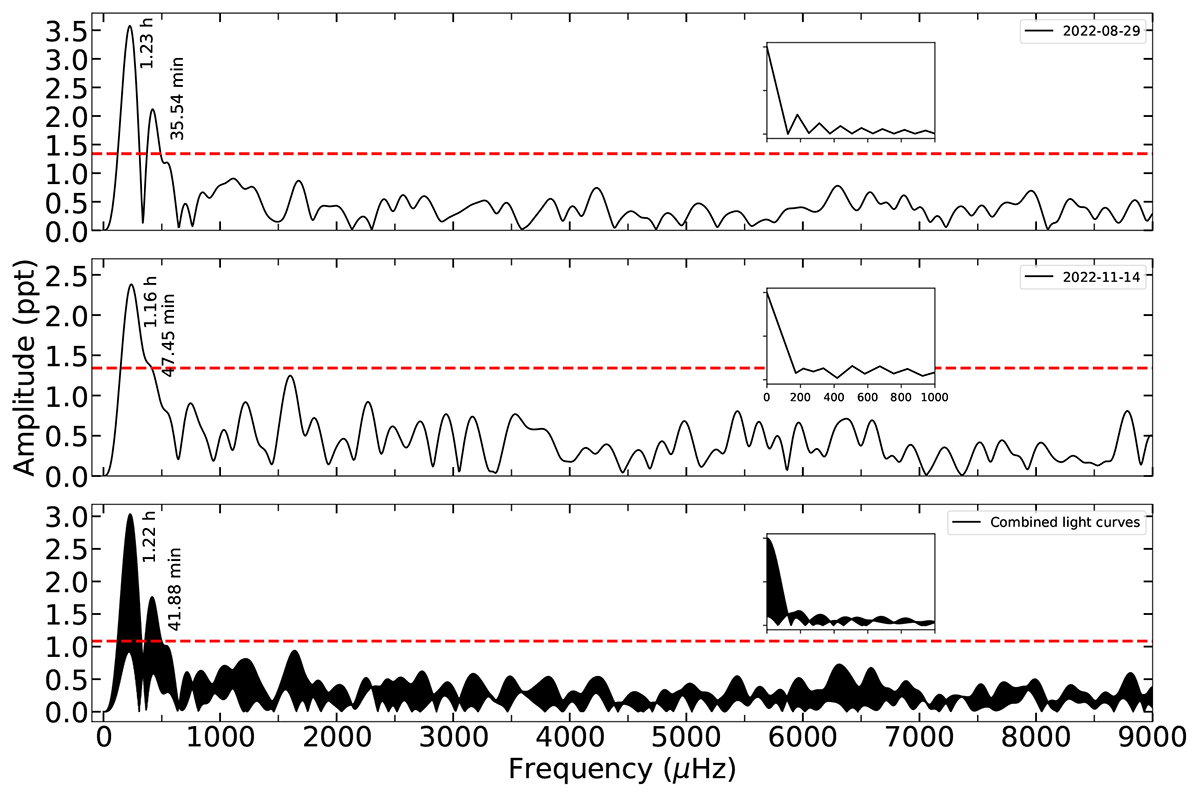
Fig. 7.
Download original image
FT for the new ELMV SDSS J212935.23+001332.3. The second and fourth observed SOAR nights are shown in the top and middle panels, respectively, while the combined data from the two nights are displayed in the bottom panel. The amplitude at the FAP = 1/1000 detection limit in each case is indicated by the horizontal dashed red line, and the spectral window for each case is depicted as an inset plot.
Current usage metrics show cumulative count of Article Views (full-text article views including HTML views, PDF and ePub downloads, according to the available data) and Abstracts Views on Vision4Press platform.
Data correspond to usage on the plateform after 2015. The current usage metrics is available 48-96 hours after online publication and is updated daily on week days.
Initial download of the metrics may take a while.