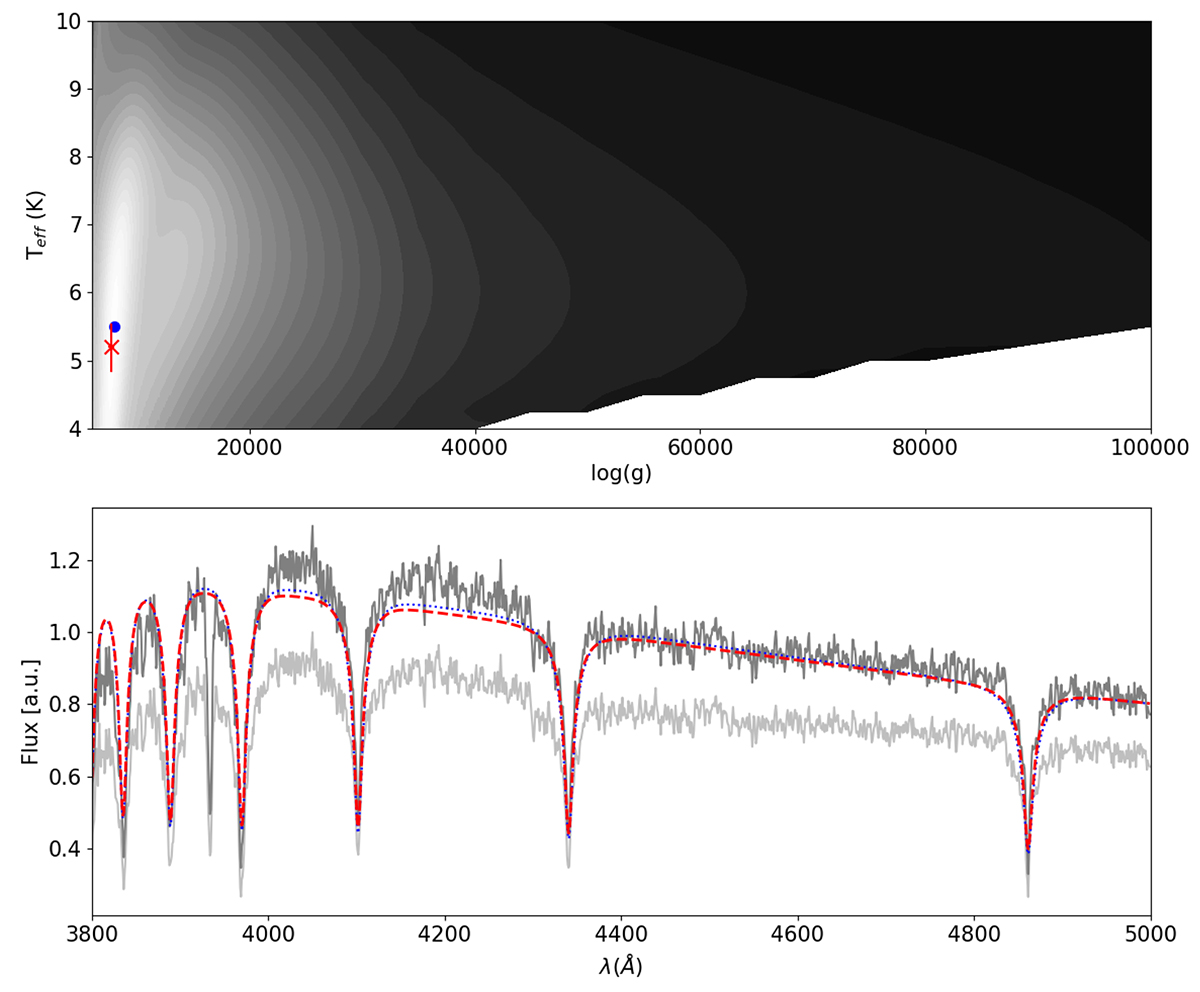
Fig. 3.
Download original image
Spectroscopic fit of J183702.03–674141.1. Top: χ2 as a function of Teff and log g. The blue dot indicates the absolute minimum. The red error bar shows the median (marked by a cross) and 68% confidence interval. Bottom: Observed spectrum (light grey), the extinction-corrected spectrum (darker grey), the model for minimum χ2 (blue), and the adopted solution (red). Note that this object has atmospheric metals that are not included in the model.
Current usage metrics show cumulative count of Article Views (full-text article views including HTML views, PDF and ePub downloads, according to the available data) and Abstracts Views on Vision4Press platform.
Data correspond to usage on the plateform after 2015. The current usage metrics is available 48-96 hours after online publication and is updated daily on week days.
Initial download of the metrics may take a while.