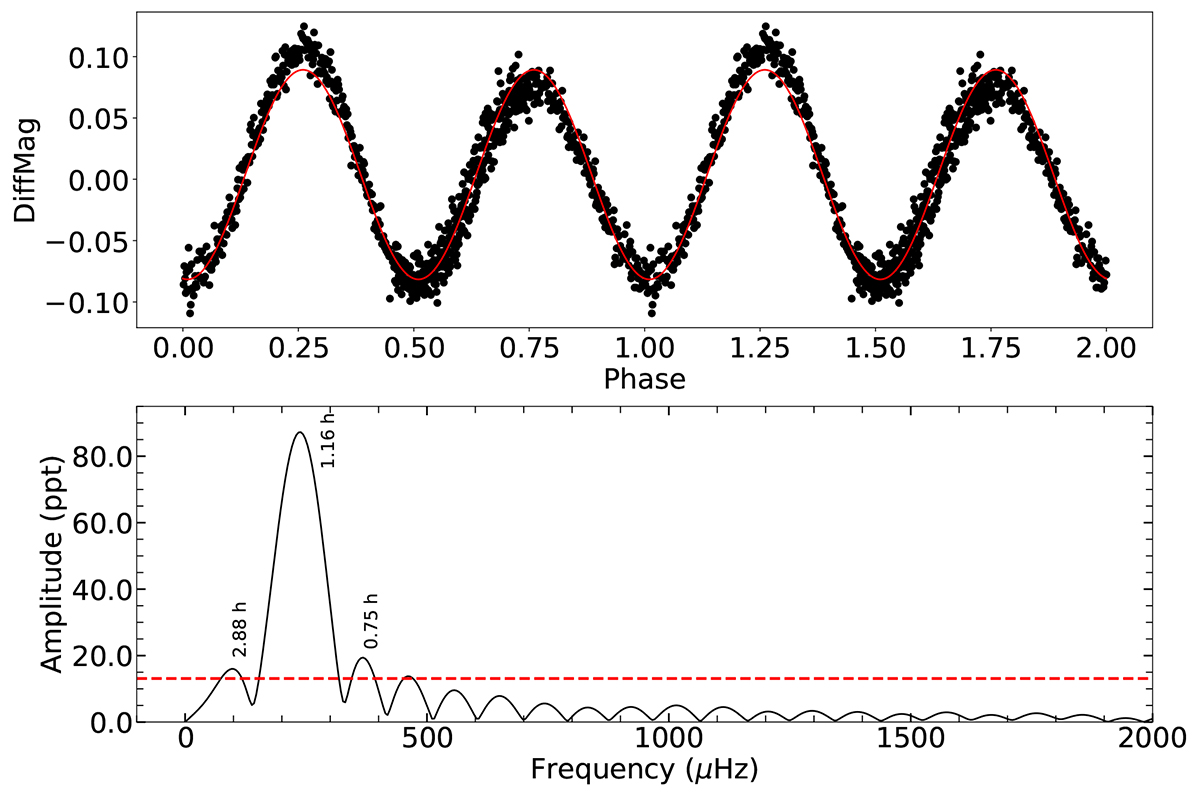
Fig. 12.
Download original image
Light Curve and Fourier Transform of SDSS J083417.21–652423.2. Top: SDSS J083417.21–652423.2 phased-folded light curve, showing the ellipsoidal variation, to Porb = 2.32 h, which is twice the period of the peak with the highest amplitude in the FT. The solid red line indicates a sinusoidal fit, depicted for a better visualisation of the variation. Bottom: FT. The horizontal dashed red line indicates our detection limit.
Current usage metrics show cumulative count of Article Views (full-text article views including HTML views, PDF and ePub downloads, according to the available data) and Abstracts Views on Vision4Press platform.
Data correspond to usage on the plateform after 2015. The current usage metrics is available 48-96 hours after online publication and is updated daily on week days.
Initial download of the metrics may take a while.