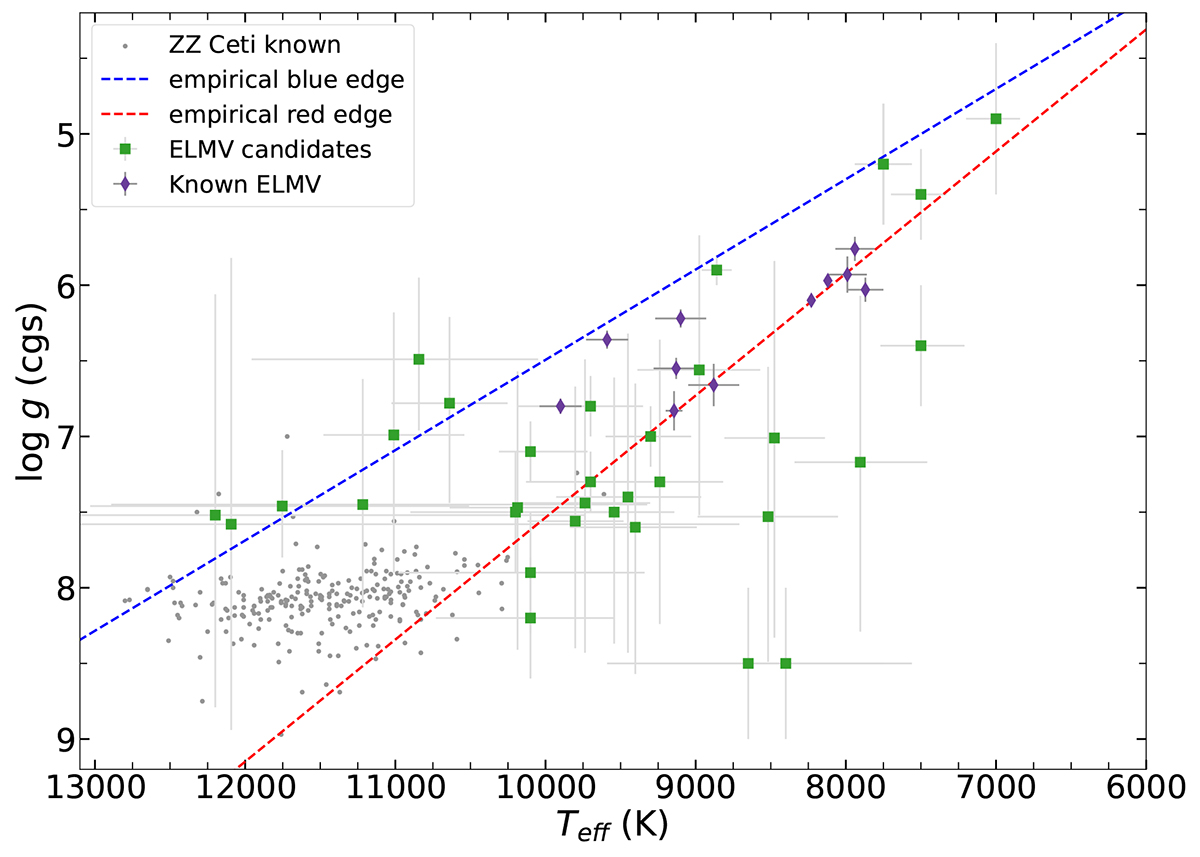
Fig. 1.
Download original image
Candidate stars in the Teff–log g plane. The positions of the candidate sample are shown as green squares in the Teff–log g plane. The known ZZ Ceti (Romero et al. 2022) and ELMVs (Hermes et al. 2012, 2013a,b; Kilic et al. 2015; Bell et al. 2015, 2017; Pelisoli et al. 2018a; Lopez et al. 2021) are shown as grey dots and purple diamonds, respectively. The ELMV found by Guidry et al. (2021) is not depicted since its atmospheric parameters have not been determined. The empirical ZZ Ceti instability strip published in Gianninas et al. (2015) is marked with dashed lines.
Current usage metrics show cumulative count of Article Views (full-text article views including HTML views, PDF and ePub downloads, according to the available data) and Abstracts Views on Vision4Press platform.
Data correspond to usage on the plateform after 2015. The current usage metrics is available 48-96 hours after online publication and is updated daily on week days.
Initial download of the metrics may take a while.