| Issue |
A&A
Volume 694, February 2025
|
|
|---|---|---|
| Article Number | L15 | |
| Number of page(s) | 8 | |
| Section | Letters to the Editor | |
| DOI | https://doi.org/10.1051/0004-6361/202453221 | |
| Published online | 18 February 2025 | |
Letter to the Editor
Discovery of ionized circumstellar gas emission around the long-period Cepheid ℓ Carinae with ALMA
1
Nicolaus Copernicus Astronomical Centre, Polish Academy of Sciences, Bartycka 18, 00-716 Warszawa, Poland
2
Nicolaus Copernicus Astronomical Center, Polish Academy of Sciences, Rabiańska 8, 87-100 Toruń, Poland
3
Leiden Observatory, Leiden University, P.O. Box 9513, 2300 RA, Leiden, The Netherlands
4
Université Côte d’Azur, Observatoire de la Côte d’Azur, CNRS, Laboratoire Lagrange, France
5
LESIA, Observatoire de Paris, Université PSL, CNRS, Sorbonne Université, Université Paris-Cité, 5 Place Jules Janssen, 92195 Meudon, France
⋆ Corresponding author; This email address is being protected from spambots. You need JavaScript enabled to view it.
Received:
29
November
2024
Accepted:
22
January
2025
Abstract
Cepheid circumstellar emissions have previously been detected using both infrared (IR) excess and IR interferometric observations at a few stellar radii. These studies have shown that these circumstellar emission can be produced by ionized gas, however, there is no direct observational evidence to confirm this hypothesis. In this letter, we explore the continuum emission and a spectrum of the bright and long-period Cepheid ℓ Car (P = 35.56 day) at millimeter-wavelengths to detect possible effects of ionized gas emission. We used ALMA observations of ℓ Car in two spectral setups in Band 6 (near 212 and 253 GHz, respectively) and compared the measured flux density to what would be expected for the stellar continuum. We also derived the spectral index and probed the presence of radio recombination lines (RRLs). We report statistically significant emission of about 3.5 mJy in the two spectral ranges, which is about 2.5 times the stellar continuum emission. For the first time, we have also been able to derive the spectral index of the flux density, (Sν ∝ να), α = +1.26 ± 0.44 (∼3σ error), which is characteristic of partially optically thick, ionized gas emission. Additionally, we discovered an emission line from a RRL of hydrogen H29α centered on the stellar rest velocity, smaller in spatial extent than about 0″.2 (≲100 AU), with a symmetric profile with a width at half power of 55.3 ± 7.5 km s−1 (1σ error). These findings confirm the presence of ionized gas emission near ℓ Car. The millimeter emission detected from ℓ Car can be attributed to ionized gas emission from the Cepheid’s chromosphere. Further radio interferometric observations are necessary to confirm the occurrence of these ionized gas envelopes around Cepheids of different pulsation periods.
Key words: methods: observational / techniques: interferometric / circumstellar matter / stars: variables: Cepheids / radio continuum: stars / radio lines: stars
© The Authors 2025
 Open Access article, published by EDP Sciences, under the terms of the Creative Commons Attribution License (https://creativecommons.org/licenses/by/4.0), which permits unrestricted use, distribution, and reproduction in any medium, provided the original work is properly cited.
This article is published in open access under the Subscribe to Open model. This email address is being protected from spambots. You need JavaScript enabled to view it. to support open access publication.
1. Introduction
The Cepheid ℓ Carinae (ℓ Car, HD 84810, HIP 47854) has the largest angular diameter among southern hemisphere Cepheids (in average 2.9 mas), making it an ideal candidate for investigating its photosphere and circumstellar environment. Additionally, with a pulsation period of P = 35.55 days, ℓ Car is the closest analog to the long-period, extragalactic Cepheids observed by the James Webb Space Telescope (JWST). Therefore, understanding the evolution and the physics of this star is important to infer the properties of the period-luminosity (PL) relation of long-period Cepheids, which directly impact the accuracy of the distance scale. This is especially important at present, as JWST is observing Cepheids in distant galaxies to refine the precision and reliability of these measurements (Freedman et al. 2024; Riess et al. 2024).
One of the intriguing phenomena associated with Cepheids is the possible presence of infrared (IR) circumstellar emission, which may serve as a tracer of their mass-loss rates (Deasy 1988) and may impact the accuracy of the PL relation (Neilson et al. 2009, 2010). However, circumstellar emission can originate in various environments, including gas and dust contributions from the local interstellar medium, extended circumstellar material produced by the star’s own mass loss, or an extended atmospheric layer near the stellar surface. Distinguishing between these components requires observations across different wavelengths and angular resolutions. For instance, Spitzer IRAC imaging has revealed low-surface-brightness emission around ℓ Car at 5.8 and 8.0 μm, extending out to a radius of approximately 35″(1.7 × 10⁴ AU; Barmby et al. 2011). Closer to the star, a comparative study in the IR with Spitzer, VLT/VISIR, and VLTI/MIDI detected emission within a radius of 1″, attributed to warm circumstellar dust of a few 100 K at a distance of about 500 AU (Kervella et al. 2009). This region might be associated to the circumstellar emission resolved at only a few stellar radii by near-IR (NIR) interferometry in the K-band through VLTI/VINCI observations around ℓ Car (Kervella et al. 2006). Subsequently, similar compact envelopes were resolved with CHARA/FLUOR (Mérand et al. 2006, 2007) around other Cepheids, as well as in the mid-IR (MIR), with MIDI and VLTI/MATISSE (Gallenne et al. 2013; Hocdé et al. 2021). However, evidence from Spitzer low-resolution spectra and VLTI/MATISSE observations (Hocdé et al. 2020b, 2025) stands in favor of the assumption of gaseous envelopes for most of the Cepheids, including ℓ Car. Therefore, these circumstellar emission could be related to an extended gas layer above the photosphere. Various authors have reported a deep and static absorption feature in the Hα line of ℓ Car (Rodgers & Bell 1968; Nardetto et al. 2008; Hocdé et al. 2020a) and a strong Mg II absorption line in the ultraviolet (UV) (Bohm-Vitense & Love 1994), attributed to a gaseous envelope centered on the stellar restframe with an extension up to about 1000 AU. Chromosphere activity is also suspected for several Cepheids, in particular for ℓ Car, from Ca II K emission (Kraft 1957), several UV emission lines (Schmidt & Parsons 1982), and the calcium IR triplet (Hocdé et al. 2020a). The presence of hot plasma is also revealed by periodic UV emission lines and X-ray emission (see, e.g., Engle et al. 2014, 2017; Andrievsky et al. 2023). In terms of modeling studies, Hocdé et al. (2020b) have shown that the IR excesses of Cepheids, including ℓ Car, can be explained by a thin envelope of ionized gas emitting free-free emission (Hocdé et al. 2021).
However, there is still no direct observational evidence of free-free emission toward Cepheids. Radio and millimeter-wave observations are useful to constrain ionized gas emission above the photospheric continuum as well as the spectral index. Prior to the recent results for δ Cep (Matthews et al. 2023), only upper limits on continuum emission were obtained for the twelve Cepheids observed with radio telescopes (Welch & Duric 1988; Altenhoff et al. 1994). In particular, radio observations with the Very Large Array at 5 GHz were performed by Welch & Duric (1988) who provided upper limits for the mass-loss rates of the order of 10−9–10−7 M⊙/yr, assuming ionized wind emission. Observations of radio spectral lines were attempted, too. Matthews et al. (2012, 2016) observed the H I 21 cm transition with the VLA for different Cepheids. Recently, the first radio detection of continuum emission associated with a Cepheid (δ Cep) was reported based on VLA observations at 10–15 GHz (Matthews et al. 2020, 2023). These authors discuss different potential mechanisms responsible for the radio emission, including free-free emission from either a chromosphere, an optically thick ionized shell, or an ionized wind. However, obtaining the spectral index is essential to differentiate these scenarios.
In this letter, we explore the first millimeter-wave observation of the bright Cepheid ℓ Car with the Atacama Large Millimeter/submillimeter Array (ALMA, Wootten & Thompson 2009) to investigate the presence and the characteristics of the ionized gas emission. The advantages of observing at higher frequencies are twofold. First, using higher frequencies increases the spatial resolution, which helps mitigate the confusion from background sources and potential companions, facilitating the study of regions at sub-arcsecond scales. Second, higher frequencies allow the observation of free-free emission from the stellar wind originating from the inner regions of the circumstellar gas, as the opacity decreases with increasing frequency. Finally, ALMA also allows us to investigate hydrogen recombination lines (Peters et al. 2012). We present the ALMA observations and reduction in Sect. 2 and the subsequent results in Sect. 3, particularly with respect to the continuum, the spectral index, and the RRL. We present our conclusions in Sect. 4.
2. Observations of ℓ Car
We observed ℓ Car with the ALMA main array on 16 December 2023, 5 May, 1 July, 13 July, and 2 October 2024. Observations were conducted in two spectral setups in Band 6. Both setups used the continuum (frequency division mode, FDM) configuration of the correlator with a coarse spectral resolution of 7.8 MHz, which is the result of averaging 16 channels before the data were stored. The first setup (setup 1) effectively covers simultaneously the spectral ranges 211.6–215.3 and 227.6–231.4 GHz at a channel binning of about 10.7 km s−1. The second spectral setup, setup 2, covers higher frequencies (255.1–258.9 and 270.9–274.6 GHz) at a channel binning of about 8.8 km s−1. The spectral setup was designed not only to provide us with a good estimate of the continuum spectral index, but also to cover a few key spectral lines; for instance, the CO 2–1 and H29α lines at 230.5 and 256.4 GHz, respectively. The CO molecules can form in the Cepheid atmospheres which are metallic enough and have temperature of about 5000 K (Scowcroft et al. 2016). The project was executed at ALMA without a specific requirement on the array configuration, and, as a consequence, our target was observed three times in setup 1 (although two of these were very close in time), and three times in setup 2 with different baseline lengths. Details of these observations can be found in Table A.1. The visibilities were calibrated by the observatory using the default pipeline in CASA (CASA Team 2022). Self-calibration in phases was attempted but did not improve the image quality, owing to an insufficient signal-to-noise ratio S/N in individual tracks. All imaging was done in CASA 6.6. using tclean procedures. Most of the analysis presented in this paper was done on images produced with natural weighting of visibilities, which optimizes the sensitivity of maps at the cost of spatial resolution.
3. Results and discussion
Our ALMA observations have resulted in a single unresolved point source at the position of ℓ Car with a beam size of about 0 6 and 0
 5, respectively, for setups 1 and 2 (see Fig. A.1). This confirms the absence of any companion of ℓ Car brighter than about 35 μJy (5σ) in Band 6 and within 15″ from the star. At uniform weighting of the visibilities which give effective resolution of 85 mas, the map shows a single point source. This is in line with earlier interferometric and radial velocity observations, which excluded the possibility of a companion (Anderson et al. 2016) and is consistent with the analysis of Gaia proper motions (Kervella et al. 2019). Flux densities for each setup and for all continuum data combined are presented in Table 1, with the flux density of 3.689 ± 0.024 mJy representing the midpoint of the covered frequencies. We inspected any possible variability among the radio emission, in particular between the observations of the second setup which are taken at different phases of the pulsation cycle. We do not find any variability between these three epochs above our measurement uncertainties (see Appendix D).
Summary of measurements and derived quantities.
To compare the measured flux density with the stellar continuum, we derived the predicted flux based on the assumption that the emission follows the Rayleigh-Jeans regime of a blackbody. Indeed, we can estimate the flux of ℓ Car at a given frequency knowing its effective temperature and angular diameter. Hereafter, we assume that the millimeter continuum is formed at a similar photospheric radius as the optical and the IR. However, we note that the millimeter continuum is formed slightly higher in the photosphere because the atmosphere becomes optically thick at increasing height, as in the case of the Sun (see, for example, Wedemeyer et al. 2016). In some extreme cases, the presence of gas in the high atmosphere can also form a radio-photosphere of much larger radius such as the ones observed in the case of AGB stars (Reid & Menten 1997). The flux density, Sν, in the Rayleigh-Jeans tail for a black-body subtended by a solid angle Ω follows the convenient form:
 (1)
(1)
which is mostly sensitive to the variation of the limb-darkening (LD) angular diameter, θ, as compared to the effective temperature, Teff.
Fortunately, the uniform disk (UD) angular diameter of ℓ Car is known precisely along the pulsation cycle owing to interferometric observations in the H-band with PIONIER/VLTI (Anderson et al. 2016) and in the K-band with VINCI/VLTI (Kervella et al. 2004), presented in Fig. B.1. In the following, we neglect the LD effect by adopting the UD angular diameter. On the contrary the effective temperature of ℓ Car is not well characterized along the pulsation cycle. We found only one measurement given by Luck (2018), with Teff = 5253 ± 38 K measured at pulsation phase ϕ = 0.05. In the following, we have adopted this measurement for the closest epoch of observations. For the effectve temperature at ϕ = 0.65 and 0.26, we adopted interpolated values derived using the parallax-of-pulsation code SPIPS (Mérand et al. 2015), as shown in Table A.1.
For setup 1 at ϕ = 0.06, the measured angular size is θ = 2.91 ± 0.04 mas (Anderson et al. 2016) and the temperature measured by Luck (2018) is adopted. Thus, we obtain an expected flux density for setup 1 of Sν = 1.23 ± 0.12 mJy, assuming a conservative 10% uncertainty because of the black-body assumption. Given the flux density of Sν = 3.31 mJy measured by ALMA, we obtain a significant excess, 2.7 times brighter than the stellar photospheric continuum. For setup 2, we obtained observations at three different pulsation phases (see Table A.1). For the three epochs of ℓ Car, we derived an average predicted flux density of Sν = 1.77 ± 0.18 mJy using Eq. (1). Therefore, the measured flux density is about 2.2 times higher than the stellar continuum. Assuming a maximum θUD value of 3.2 mas for ℓ Car (at ϕ ≈ 0.4, see Fig. B.1), the upper limit for the flux density expected is Sν ≈ 1.9 mJy. We present these measurements in Fig. 1, together with the photometry obtained in the visible and the IR (see Table B.1) and an ATLAS9 atmosphere model (Castelli et al. 2003) derived from the effective temperature and the angular diameter corresponding to the pulsation phase of setup 2. From this figure, it is clear that the radio emission deviates significantly from Rayleigh-Jeans continuum of the star. We used the measured spectral index to constrain the mechanism giving rise to the millimeter emission.
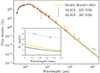 |
Fig. 1. SED of ℓ Car complemented with ALMA flux density in Band 6 from setup (221 GHz) and 2 (261 GHz) presented in Table A.1 and detailed in Sect. 2. 5σ errors are displayed on the figure for all the data. Flux density for each band is presented in Table B.1. The grey dashed line represent a spectral index of αν = +1.26 (equivalent to αλ = −0.74) as derived in Sect. 3.1. The SED is derived from an ATLAS9 model (derived up to 10 μm and extrapolated beyond) with Teff and angular diameter corresponding to the epoch of the setup observation, which fits the optical and NIR well. The envelope model of ionized gas of constant density from Hocdé et al. (2021) is shown in yellow. See this paper for a more detailed analysis and a discussion of the impact of free-bound emission in the optical and NIR bands. |
3.1. Spectral index
For the first time, we were able to derive the spectral index of the radio emission of a Cepheid, which is essential for understanding the origin of this emission (see Table 1). We derived an average spectral index of +1.26 ± 0.06 (1σ). We calculated the spectral index using CASA’s tclean algorithm mt-mfs1 by applying a second-order (N = 2) Taylor series. In the resulting maps, the spectral index α shows some variations within the region with strong continuum emission; thus, we took the average value from pixels lying roughly within a contour of 20% peak flux as the representative α. As the associated uncertainty, we took the corresponding average 1σ error calculated in tclean (see Appendix C for an alternative method). When combining data from two different setups, the results depend quite strongly on the cross-calibration between the basebands. Our flux and bandpass calibration were performed using quasars, for which the observatory claims flux accuracy of about 10% (but see Francis et al. 2020). For setups 1 and 2 combined, this uncertainty translates to a systematic error in α of about 0.4. Therefore, we adopted α = +1.26 ± 0.44 (3σ).
Based on the hypothesis that excess flux is caused by free-free emission, the spectral index α (Sν ∝ να) constrains the physical characteristics of the emission region. For free-free emission from a spherical, symmetrically distributed ionized gas component with constant electron density, the spectral index shifts from α = −0.1 in the optically thin regime (observed at frequencies above a critical threshold ν > νc) to α = +2 in the optically thick regime at lower frequencies (Wright & Barlow 1975; Panagia & Felli 1975; Olnon 1975). This is, for example, the model proposed by Hocdé et al. (2020b) to explain the IR excess of Cepheids constrained by low-resolution spectra from Spitzer, which shows optically thick emission in the MIR (see the model for ℓ Car in Fig. 1). The spectral index at low frequency depends mostly on the density distribution of the ionized gas environment. Hence, the spectral index tends to +0.6 at low frequencies for emission in expanding envelopes corresponding to a spherically symmetric ionized wind with a density distribution given as ne ∝ r−2. The spectral index calculated in CASA is twice larger than the nominal value of ionized wind emission. This spectral index is also comparable to chromospheric emission of the red supergiant (RSG) Antares in the millimeter regime (α = +1.27 at 145 GHz, O’Gorman et al. 2020) and also Betelgeuse in the centimeter (α = +1.33, see O’Gorman et al. 2015, and references therein). In these chromospheric regions of RSGs, the gas is partially optical thick, with a steep gradient in the ionized gas density. Specifically, the spectral index found in the case of ℓ Car might be explained if the electron density scales as ne ∝ r−3.0 (Panagia & Felli 1975). However, this spectral index is below the one derived in the model developed for ℓ Car and constrained by IR data (Hocdé et al. 2021) (see Fig. 1). This demonstrates the importance of taking into account the density distribution when modeling the ionized gas emission. Also, we cannot exclude the possibility that lower frequencies could probe the wind-dominated emission regime with ν+0.6, while observations at ∼200 GHz are most sensitive to the inner regions of the gas envelope. Therefore, future observations at both higher and lower frequencies will help to probe the structure of the ionized gas environment of ℓ Car.
3.2. Radio recombination line H29α
Emission lines from Rydberg transition of hydrogen are produced from radiative recombination at high principal quantum numbers. They are an excellent tracers of ionized gas (Gordon & Sorochenko 2002). For example, emission from H30α was recently detected close to the surface of Betelgeuse at about 230 GHz (Dent et al. 2024). These authors proposed that periodic shocks might be the origin of the emission in the atmosphere.
Within our setup observations, we found a spectral feature which we identify as H29α, which is a radio recombination line of Rydberg-like transition from principal quantum number n = 29 of hydrogen. The emission coincides spatially with the continuum emission of ℓ Car. At the reference frequency of 256.302035 GHz, the emission is seen from –54 to 29 km s−1 (local standard of rest, LSR). Due to a coarse spectral sampling (8.8 km s−1) and a modest signal-to-noise ratio (S/N), this range probably overestimates the spread of the emission. The velocity-integrated emission has a peak at 71.5 mJy/beam km s−1 on maps (see Fig. A.2a) with rms noise of 6.63 mJy/beam km s−1. In the general case, the RRL profile results from the convolution of a Gaussian component accounting for thermal and microturbulent broadening, along with a Lorentzian component due to electron pressure broadening, as outlined by Brocklehurst & Seaton (1972). Hereafter, we assumed only a Gaussian profile for simplicity, as the low S/N prevents a more detailed modeling. A Gaussian fit to the feature yields a full width at half power (FWHM) of 55.3 ± 7.5 km s−1 and a line center at −6.2 ± 3.2 km s−1 (1σ, LSR). For comparison, Dent et al. (2024) measured a FWHM of ≈42 km s−1 for H30α from the chromosphere of Betelgeuse. The central velocity is equivalent to 7.2 km s−1 in the Solar System barycenter frame and it is thus is within the 3σ error, consistent with the catalog systemic velocity of ℓ Car of 3.4 km s−1 in the same rest frame (Anderson et al. 2024). There is no doubt that the Hα emission originates from ℓ Car. The current data do not allow us to conclusively determine the symmetry of the H29α line, which can be useful to probe local thermodynamical equilibrium conditions (Peters et al. 2012). Data at a better S/N and spectral resolution are necessary to verify this result.
The flux of ℓ Car’s H29α emission integrated over the spectral profile is 72.2 mJy km s−1 or on average 0.9 mJy per channel in the ∼80 km s−1 range occupied by the Hα emission. This line flux is approximately equivalent to 35% of the continuum flux level at the same frequencies (3.5 mJy). The continuum flux is a combination of the photospheric component, estimated at this frequency to be 1.5 mJy from Eq. (1), and the atmospheric or circumstellar component, which we calculated simply as the total measured continuum flux minus the photospheric component, 3.5–1.5 = 2.0 mJy (cf. Table 1). The photospheric contribution was calculated as the blackbody radiation of a star with an effective temperature of 4850 K and an angular diameter of 2.9 mas, representing the average properties of ℓ Car. Our calculation therefore leads to a flux ratio of line to non-photospheric continuum of about 0.45. This can be used to calculate the electron temperature of the plasma following the transfer equation for RRLs. With Eq. (2.124) in Gordon & Sorochenko (2002), a line width of 63 MHz, and an oscillator strength of 5.8174132 (Goldwire 1968), we find that an electron temperature of 23 500 K best explains the observed ratio; however, the uncertainty in this value is very large, roughly 10 000 K (propagated from the error in the flux of the emission line), due to a very low S/N and uncertain intrinsic line width. Also, the formula assumes optically thin emission for both components. Considering these limitations, we cannot exclude that the electron temperature is considerably higher than 23 500 K. On the other hand, assuming optically thick gas, we can estimate a lower limit for the mean brightness temperature using Eq. (1). We find a lower limit of 14 000 K and 11 000 K fors setups 1 and 2, respectively, assuming the star angular diameter, which rapidly drops off to θ−2 for a larger source.
4. Conclusions
In this letter, we present ALMA observations of continuum and H29α emission for the long-period Cepheid ℓ Car. The presence of a ionized circumstellar gas is inferred from the following observational results
-
We measured a continuum emission of about 3.5 mJy at 200 GHz (1mm), which is about 2.5 times brighter than the stellar photospheric continuum at these frequencies.
-
We derived a mean spectral index (Sν ∝ να) of α = +1.26 ± 0.44, indicating partially optically thick ionized gas emission, similar to chromospheric emission from RSGs.
-
We detected, for the first time, a RRL of H29α centered on the ℓ Car restframe and smaller than about 0
 2 (≈100 au, ≈140 R⋆), which is direct evidence for the presence of ionized gas physically connected to the Cepheid. We derived a temperature of the gas of the order of few 104 K.
 -
We do not find any significant evidence of variability among the different epochs of observations.
In summary, these observations reveal the emission of ionized gas connected to the star which is distinct from the photospheric emission. The spectral index derived is higher than expected from free-free emission of partially ionized wind, which prevents us from estimating a mass-loss rate. However, we cannot exclude the possibility that such emission can be detected at lower frequency. Our results suggest that the free-free emission originates from the hot gas of the star chromosphere, in line with previous emission lines from the literature for this star (Kraft 1957; Schmidt & Parsons 1982; Bohm-Vitense & Love 1994). However, the millimeter emission is not explained by the current model of the shell of ionized gas from Hocdé et al. (2020b); Hocdé et al. (2021), which suggests that this model could be improved by inclusion of density gradient and temperature. Interestingly, we find no significant evidence of variability of the emission in contrast to the results of Matthews et al. (2023) for δ Cep, which suggests that the free-free emission of ℓ Car is not directly linked to the pulsation. The temperature of the gas, estimated to be on the order of 104 K, is not compatible with X-ray emission either. The fact that the measurements of the spectral index and RRL of H29α are similar to what has been found for RSGs of a much lower effective temperature and with very active atmospheres also suggests that convection plays an active role in heating up the gas, as previously noted by Sasselov & Lester (1994a,b). Finally, given that ℓ Car is a nearby analog to the long-period Cepheids observed by the JWST, it is likely that other extragalactic Cepheids possess similar ionized gas emissions as well. Considering the work of Neilson et al. (2009, 2010), who suggested that dust emission could impact the slope and the zero-point of the PL relation in different bands, the question remains whether ionized gas emission could affect the PL relation in the optical and the NIR. Further observations are essential to reconstruct a complete radio SED, enabling us to better determine the temperature profile and physical properties of the ionized gas and for a larger sample of Cepheids.
Acknowledgments
We gratefully thank the referee for valuable comments and suggestions. This paper makes use of the following ALMA data: ADS/JAO.ALMA#2023.1.00196.S and ADS/JAO.ALMA#2024.1.00315.S. ALMA is a partnership of ESO (representing its member states), NSF (USA) and NINS (Japan), together with NRC (Canada), NSTC and ASIAA (Taiwan), and KASI (Republic of Korea), in cooperation with the Republic of Chile. The Joint ALMA Observatory is operated by ESO, AUI/NRAO and NAOJ. The research leading to these results has received funding from the European Research Council (ERC) under the European Union’s Horizon 2020 research and innovation programme (grant agreements No 695099 and No 951549). This work received the funding from the Polish-French Marie Skłodowska-Curie and Pierre Curie Science Prize awarded by the Foundation for Polish Science and the Polish Ministry of Science and Higher Education grant agreement 2024/WK/02. The authors acknowledge the support of the French Agence Nationale de la Recherche (ANR) under grant ANR-23-CE31-0009-01 (Unlock-pfactor). This research made use of the SIMBAD and VIZIER (Available at http://cdsweb.u-strasbg.fr/) databases at CDS, Strasbourg (France) and the electronic bibliography maintained by the NASA/ADS system. This research also made use of Astropy, a community-developed core Python package for Astronomy (Astropy Collaboration 2018). This research has benefited from the help of SUV, the VLTI user support service of the Jean-Marie Mariotti Center (http://www.jmmc.fr/suv.htm). This research has also made use of the Jean-Marie Mariotti Center Aspro service (Available at http://www.jmmc.fr/aspro).
References
- Altenhoff, W. J., Thum, C., & Wendker, H. J. 1994, A&A, 281, 161 [NASA ADS] [Google Scholar]
- Anderson, R. I., Mérand, A., Kervella, P., et al. 2016, MNRAS, 455, 4231 [Google Scholar]
- Anderson, R. I., Viviani, G., Shetye, S. S., et al. 2024, A&A, 686, A177 [NASA ADS] [CrossRef] [EDP Sciences] [Google Scholar]
- Andrievsky, S. M., Kovtyukh, V. V., & Korotin, S. A. 2023, A&A, 671, A27 [NASA ADS] [CrossRef] [EDP Sciences] [Google Scholar]
- Astropy Collaboration (Price-Whelan, A. M., et al.) 2018, AJ, 156, 123 [Google Scholar]
- Barmby, P., Marengo, M., Evans, N. R., et al. 2011, AJ, 141, 42 [NASA ADS] [CrossRef] [Google Scholar]
- Bohm-Vitense, E., & Love, S. G. 1994, ApJ, 420, 401 [Google Scholar]
- Brocklehurst, M., & Seaton, M. J. 1972, MNRAS, 157, 179 [NASA ADS] [CrossRef] [Google Scholar]
- CASA Team (Bean, B., et al.) 2022, PASP, 134, 114501 [NASA ADS] [CrossRef] [Google Scholar]
- Castelli, F., & Kurucz, R. L. 2003, in Modelling of Stellar Atmospheres, eds. N. Piskunov, W. W. Weiss, & D. F. Gray, IAU Symp., 210, A20 [Google Scholar]
- Csörnyei, G., Szabados, L., Molnár, L., et al. 2022, MNRAS, 511, 2125 [CrossRef] [Google Scholar]
- Deasy, H. P. 1988, MNRAS, 231, 673 [NASA ADS] [Google Scholar]
- Dent, W. R. F., Harper, G. M., Richards, A. M. S., Kervella, P., & Matthews, L. D. 2024, ApJ, 966, L13 [NASA ADS] [CrossRef] [Google Scholar]
- Engle, S. G., Guinan, E. F., Harper, G. M., Neilson, H. R., & Remage Evans, N. 2014, ApJ, 794, 80 [NASA ADS] [CrossRef] [Google Scholar]
- Engle, S. G., Guinan, E. F., Harper, G. M., et al. 2017, ApJ, 838, 67 [NASA ADS] [CrossRef] [Google Scholar]
- Fouqué, P., Arriagada, P., Storm, J., et al. 2007, A&A, 476, 73 [NASA ADS] [CrossRef] [EDP Sciences] [Google Scholar]
- Francis, L., Johnstone, D., Herczeg, G., Hunter, T. R., & Harsono, D. 2020, AJ, 160, 270 [NASA ADS] [CrossRef] [Google Scholar]
- Freedman, W. L., & Madore, B. F. 2024, in IAU Symposium, eds. R. de Grijs, P. A. Whitelock, & M. Catelan, IAU Symp., 376, 1 [NASA ADS] [Google Scholar]
- Gaia Collaboration (Vallenari, A., et al.) 2023, A&A, 674, A1 [NASA ADS] [CrossRef] [EDP Sciences] [Google Scholar]
- Gallenne, A., Mérand, A., Kervella, P., et al. 2013, A&A, 558, A140 [NASA ADS] [CrossRef] [EDP Sciences] [Google Scholar]
- Goldwire, H. C. Jr 1968, ApJS, 17, 445 [NASA ADS] [CrossRef] [Google Scholar]
- Gordon, M. A., & Sorochenko, R. L. 2002, Radio Recombination Lines. Their Physics and Astronomical Applications, 282 (Dordrecht: Kluwer Academic Publishers) [CrossRef] [Google Scholar]
- Herschel Team (Schulz, B., et al.) 2024, VizieR Online Data Catalog: Herschel/SPIRE point source catalog (HSPSC) (Herschel team+, 2017), VizieR On-line Data Catalog: VIII/112. Originally published. In: Herschel catalogs (2017) [Google Scholar]
- Hocdé, V., Nardetto, N., Borgniet, S., et al. 2020a, A&A, 641, A74 [EDP Sciences] [Google Scholar]
- Hocdé, V., Nardetto, N., Lagadec, E., et al. 2020b, A&A, 633, A47 [NASA ADS] [CrossRef] [EDP Sciences] [Google Scholar]
- Hocdé, V., Nardetto, N., Matter, A., et al. 2021, A&A, 651, A92 [NASA ADS] [CrossRef] [EDP Sciences] [Google Scholar]
- Hocdé, V., Matter, A., Nardetto, N., et al. 2025, A&A, 694, A101 [NASA ADS] [CrossRef] [EDP Sciences] [Google Scholar]
- Kervella, P., Nardetto, N., Bersier, D., Mourard, D., & Coudé du Foresto, V. 2004, A&A, 416, 941 [NASA ADS] [CrossRef] [EDP Sciences] [Google Scholar]
- Kervella, P., Mérand, A., Perrin, G., & Coudé du Foresto, V. 2006, A&A, 448, 623 [NASA ADS] [CrossRef] [EDP Sciences] [Google Scholar]
- Kervella, P., Mérand, A., & Gallenne, A. 2009, A&A, 498, 425 [NASA ADS] [CrossRef] [EDP Sciences] [Google Scholar]
- Kervella, P., Gallenne, A., Evans, N. R., et al. 2019, A&A, 623, A116 [NASA ADS] [CrossRef] [EDP Sciences] [Google Scholar]
- Kraft, R. P. 1957, ApJ, 125, 336 [NASA ADS] [CrossRef] [Google Scholar]
- Luck, R. E. 2018, AJ, 156, 171 [Google Scholar]
- Marton, G., Gezer, I., Madarász, M., et al. 2024, A&A, 688, A203 [NASA ADS] [CrossRef] [EDP Sciences] [Google Scholar]
- Matthews, L. D., Marengo, M., Evans, N. R., & Bono, G. 2012, ApJ, 744, 53 [NASA ADS] [CrossRef] [Google Scholar]
- Matthews, L. D., Marengo, M., & Evans, N. R. 2016, AJ, 152, 200 [NASA ADS] [CrossRef] [Google Scholar]
- Matthews, L. D., Evans, N. R., & Rupen, M. P. 2020, Am. Astron. Soc. Meeting Abstr., 235, 10603 [NASA ADS] [Google Scholar]
- Matthews, L. D., Evans, N. R., & Rupen, M. P. 2023, AJ, 165, 92 [NASA ADS] [CrossRef] [Google Scholar]
- Mérand, A., Kervella, P., Coudé du Foresto, V., et al. 2006, A&A, 453, 155 [CrossRef] [EDP Sciences] [Google Scholar]
- Mérand, A., Aufdenberg, J. P., Kervella, P., et al. 2007, ApJ, 664, 1093 [Google Scholar]
- Mérand, A., Kervella, P., Breitfelder, J., et al. 2015, A&A, 584, A80 [NASA ADS] [CrossRef] [EDP Sciences] [Google Scholar]
- Nardetto, N., Groh, J. H., Kraus, S., Millour, F., & Gillet, D. 2008, A&A, 489, 1263 [NASA ADS] [CrossRef] [EDP Sciences] [Google Scholar]
- Neilson, H. R., Ngeow, C.-C., Kanbur, S. M., & Lester, J. B. 2009, ApJ, 692, 81 [NASA ADS] [CrossRef] [Google Scholar]
- Neilson, H. R., Ngeow, C.-C., Kanbur, S. M., & Lester, J. B. 2010, ApJ, 716, 1136 [NASA ADS] [CrossRef] [Google Scholar]
- Neugebauer, G., Habing, H. J., van Duinen, R., et al. 2019, IRAS Point Source Catalog v2.1 (PSC), NASA IPAC DataSet, IRSA4, https://doi.org/10.26131/IRSA4 [Google Scholar]
- O’Gorman, E., Harper, G. M., Brown, A., et al. 2015, A&A, 580, A101 [NASA ADS] [CrossRef] [EDP Sciences] [Google Scholar]
- O’Gorman, E., Harper, G. M., Ohnaka, K., et al. 2020, A&A, 638, A65 [NASA ADS] [CrossRef] [EDP Sciences] [Google Scholar]
- Olnon, F. M. 1975, A&A, 39, 217 [NASA ADS] [Google Scholar]
- Panagia, N., & Felli, M. 1975, A&A, 39, 1 [Google Scholar]
- Peters, T., Longmore, S. N., & Dullemond, C. P. 2012, MNRAS, 425, 2352 [NASA ADS] [CrossRef] [Google Scholar]
- Reid, M. J., & Menten, K. M. 1997, ApJ, 476, 327 [NASA ADS] [CrossRef] [Google Scholar]
- Riess, A. G., Anand, G. S., Yuan, W., et al. 2024, ApJ, 962, L17 [NASA ADS] [CrossRef] [Google Scholar]
- Rodgers, A. W., & Bell, R. A. 1968, MNRAS, 138, 23 [Google Scholar]
- Sasselov, D. D., & Lester, J. B. 1994a, ApJ, 423, 795 [NASA ADS] [CrossRef] [Google Scholar]
- Sasselov, D. D., & Lester, J. B. 1994b, ApJ, 423, 777 [NASA ADS] [CrossRef] [Google Scholar]
- Schmidt, E. G., & Parsons, S. B. 1982, ApJS, 48, 185 [NASA ADS] [CrossRef] [Google Scholar]
- Scowcroft, V., Seibert, M., Freedman, W. L., et al. 2016, MNRAS, 459, 1170 [Google Scholar]
- Smith, B. J., Price, S. D., & Baker, R. I. 2004, ApJS, 154, 673 [NASA ADS] [CrossRef] [Google Scholar]
- Wedemeyer, S., Bastian, T., Brajša, R., et al. 2016, Space Sci. Rev., 200, 1 [Google Scholar]
- Welch, D. L., & Duric, N. 1988, AJ, 95, 1794 [NASA ADS] [CrossRef] [Google Scholar]
- Wootten, A., & Thompson, A. R. 2009, IEEE Proc., 97, 1463 [NASA ADS] [CrossRef] [Google Scholar]
- Wright, A. E., & Barlow, M. J. 1975, MNRAS, 170, 41 [Google Scholar]
Appendix A: Observational material
The observations hereafter are introduced in Sect. 2. Figs. A.1 and A.2 present the ALMA continuum observations and the radio recombination line H29α respectively.
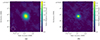 |
Fig. A.1. ALMA continuum observation of ℓ Car in (left) setup 1 (221.61 GHz) and (right) setup 2 (264.86 GHz) displayed on a 5″ × 5″ field of view. The beam sizes for the two setups are given on the bottom left corner (see also Table B.1). |
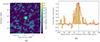 |
Fig. A.2. Detection of the radio recombination line H29α toward ℓ Car (see Sect. 3.2). The left map presents the total emission integrated over the line profile, while the right panel presents the spectrum extracted at the pixel with maximum emission. Continuum emission was subtracted from the visibilities before imaging of the line emission. The histogram presents the observations, while the red dashed line present a Gaussian fit to the line profile. |
Journal of ALMA observations together with ℓ Car temperature and angular diameter.
Appendix B: Photometry and angular diameter measurements
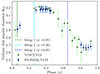 |
Fig. B.1. Uniform disk angular diameter variation of ℓ Car obtained from VINCI/VLTI and PIONIER/VLTI measurements (Kervella et al. 2004; Anderson et al. 2016). The dashed lines represent the three pulsation phases of observation at ≈0.05, 0.26 and 0.65 for setups 1 and 2 (see Table 1). |
Flux density in Janskys (Jy) at different wavelengths with associated uncertainties. The SED is displayed in Fig. 1 complemented with ALMA observations. I19: Neugebauer et al. (2019), S04: Smith et al. (2004), F07: Fouqué et al. (2007), K09: Kervella et al. (2009), M24: Marton et al. (2024), H24: Herschel Team (2024).
Appendix C: Spectral index fit
As an alternative method of deriving α presented in Sect. 3.1, we generated a full spectrum of the map area within the 20% contour and fitted a line to the logarithmic version of the spectrum (log λ vs log Fν), as shown in Fig. C.1. This resulted in α=+1.78±0.03 (1σ), a value higher than that obtained in CASA in Sect. 3.1. However, since the simple linear fit is more prone to calibration errors between the different frequency setups of the correlator (cf. Francis et al. 2020), we favor the result obtained in CASA.
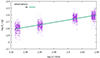 |
Fig. C.1. Fit to combined spectra from setups 1 and 2. Spectra were extracted from maps obtained at natural weighting and with the same synthesized beam. The extraction aperture was defined by the contour at 20% of maximum flux. |
Appendix D: Fluxes in individual epochs
Flux densities were measured for each individual observation on restored images and using a Gaussian fit. They are presented in Table D.1 along with the associated 1σ errors derived from the statistical noise in the data and to the goodness of the fit2. The fluxes measured for the last epoch in setup 2, on 2 Oct 2024, are over 30% higher than in both earlier epochs. Although this discrepancy exceeds the 5σ statistical uncertainties and 10% calibration errors from ALMA documentation, all measurements are consistent within the more realistic statistical errors from practical applications, as shown by (Francis et al. 2020).
Flux measurements for individual observations.
All Tables
Journal of ALMA observations together with ℓ Car temperature and angular diameter.
Flux density in Janskys (Jy) at different wavelengths with associated uncertainties. The SED is displayed in Fig. 1 complemented with ALMA observations. I19: Neugebauer et al. (2019), S04: Smith et al. (2004), F07: Fouqué et al. (2007), K09: Kervella et al. (2009), M24: Marton et al. (2024), H24: Herschel Team (2024).
All Figures
|
Fig. 1. SED of ℓ Car complemented with ALMA flux density in Band 6 from setup (221 GHz) and 2 (261 GHz) presented in Table A.1 and detailed in Sect. 2. 5σ errors are displayed on the figure for all the data. Flux density for each band is presented in Table B.1. The grey dashed line represent a spectral index of αν = +1.26 (equivalent to αλ = −0.74) as derived in Sect. 3.1. The SED is derived from an ATLAS9 model (derived up to 10 μm and extrapolated beyond) with Teff and angular diameter corresponding to the epoch of the setup observation, which fits the optical and NIR well. The envelope model of ionized gas of constant density from Hocdé et al. (2021) is shown in yellow. See this paper for a more detailed analysis and a discussion of the impact of free-bound emission in the optical and NIR bands. |
| In the text | |
|
Fig. A.1. ALMA continuum observation of ℓ Car in (left) setup 1 (221.61 GHz) and (right) setup 2 (264.86 GHz) displayed on a 5″ × 5″ field of view. The beam sizes for the two setups are given on the bottom left corner (see also Table B.1). |
| In the text | |
|
Fig. A.2. Detection of the radio recombination line H29α toward ℓ Car (see Sect. 3.2). The left map presents the total emission integrated over the line profile, while the right panel presents the spectrum extracted at the pixel with maximum emission. Continuum emission was subtracted from the visibilities before imaging of the line emission. The histogram presents the observations, while the red dashed line present a Gaussian fit to the line profile. |
| In the text | |
|
Fig. B.1. Uniform disk angular diameter variation of ℓ Car obtained from VINCI/VLTI and PIONIER/VLTI measurements (Kervella et al. 2004; Anderson et al. 2016). The dashed lines represent the three pulsation phases of observation at ≈0.05, 0.26 and 0.65 for setups 1 and 2 (see Table 1). |
| In the text | |
|
Fig. C.1. Fit to combined spectra from setups 1 and 2. Spectra were extracted from maps obtained at natural weighting and with the same synthesized beam. The extraction aperture was defined by the contour at 20% of maximum flux. |
| In the text | |
Current usage metrics show cumulative count of Article Views (full-text article views including HTML views, PDF and ePub downloads, according to the available data) and Abstracts Views on Vision4Press platform.
Data correspond to usage on the plateform after 2015. The current usage metrics is available 48-96 hours after online publication and is updated daily on week days.
Initial download of the metrics may take a while.