Fig. 1.
Download original image
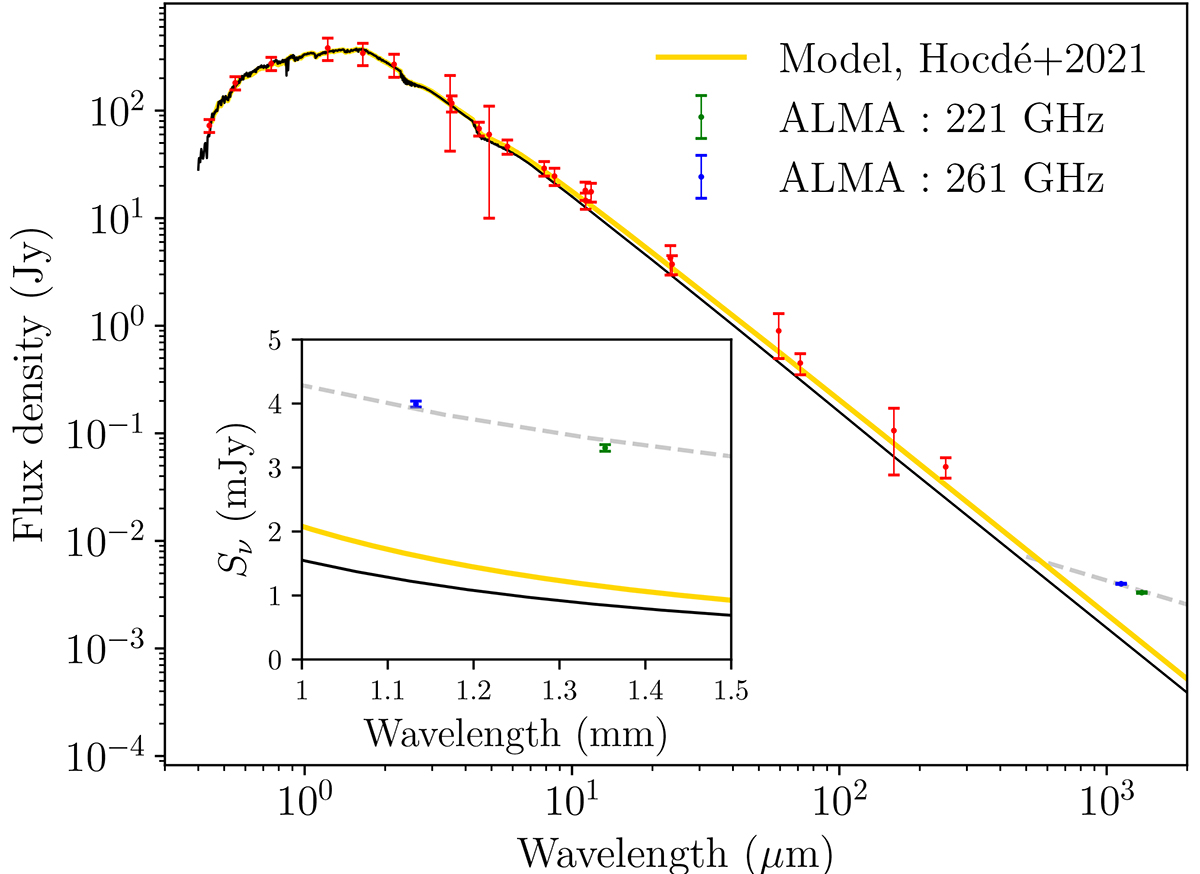
SED of ℓ Car complemented with ALMA flux density in Band 6 from setup (221 GHz) and 2 (261 GHz) presented in Table A.1 and detailed in Sect. 2. 5σ errors are displayed on the figure for all the data. Flux density for each band is presented in Table B.1. The grey dashed line represent a spectral index of αν = +1.26 (equivalent to αλ = −0.74) as derived in Sect. 3.1. The SED is derived from an ATLAS9 model (derived up to 10 μm and extrapolated beyond) with Teff and angular diameter corresponding to the epoch of the setup observation, which fits the optical and NIR well. The envelope model of ionized gas of constant density from Hocdé et al. (2021) is shown in yellow. See this paper for a more detailed analysis and a discussion of the impact of free-bound emission in the optical and NIR bands.
Current usage metrics show cumulative count of Article Views (full-text article views including HTML views, PDF and ePub downloads, according to the available data) and Abstracts Views on Vision4Press platform.
Data correspond to usage on the plateform after 2015. The current usage metrics is available 48-96 hours after online publication and is updated daily on week days.
Initial download of the metrics may take a while.