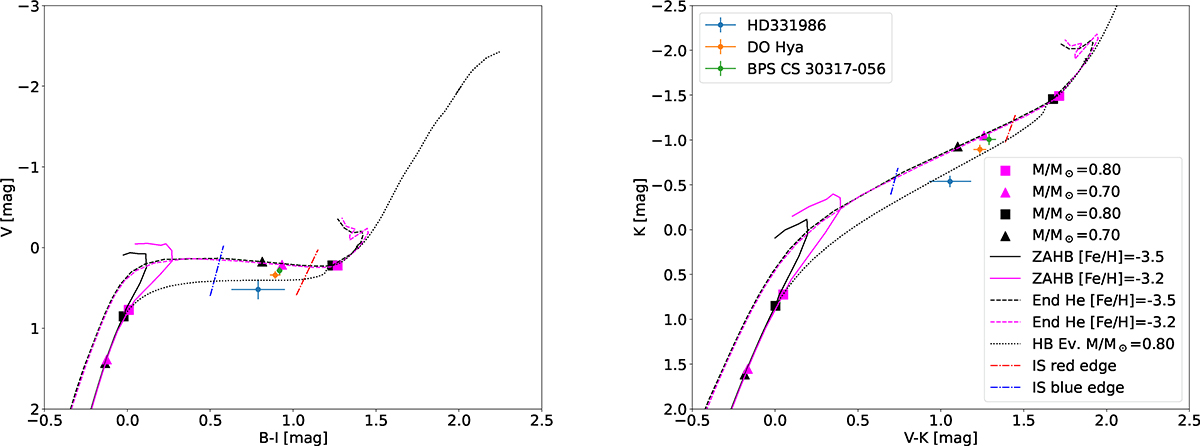
Fig. 4.
Download original image
Left: optical B − I, V CMD showing the location of very metal-poor RRLs. The solid lines display predicted ZAHBs at different chemical compositions (see labelled values), while the dashed lines the central helium exhaustion for the same chemical compositions (Pietrinferni et al. 2021). Squares and triangles mark different stellar masses along the ZAHB and end-of-helium. The almost vertical lines display the blue (hot) and the red (cool) edge of the predicted RRL instability strip for Z = 1 × 10⁻⁵ specifically computed for this investigation (see text for more details). Right: same as the left, but for the optical-NIR (V − K, K) CMD.
Current usage metrics show cumulative count of Article Views (full-text article views including HTML views, PDF and ePub downloads, according to the available data) and Abstracts Views on Vision4Press platform.
Data correspond to usage on the plateform after 2015. The current usage metrics is available 48-96 hours after online publication and is updated daily on week days.
Initial download of the metrics may take a while.