Fig. 3.
Download original image
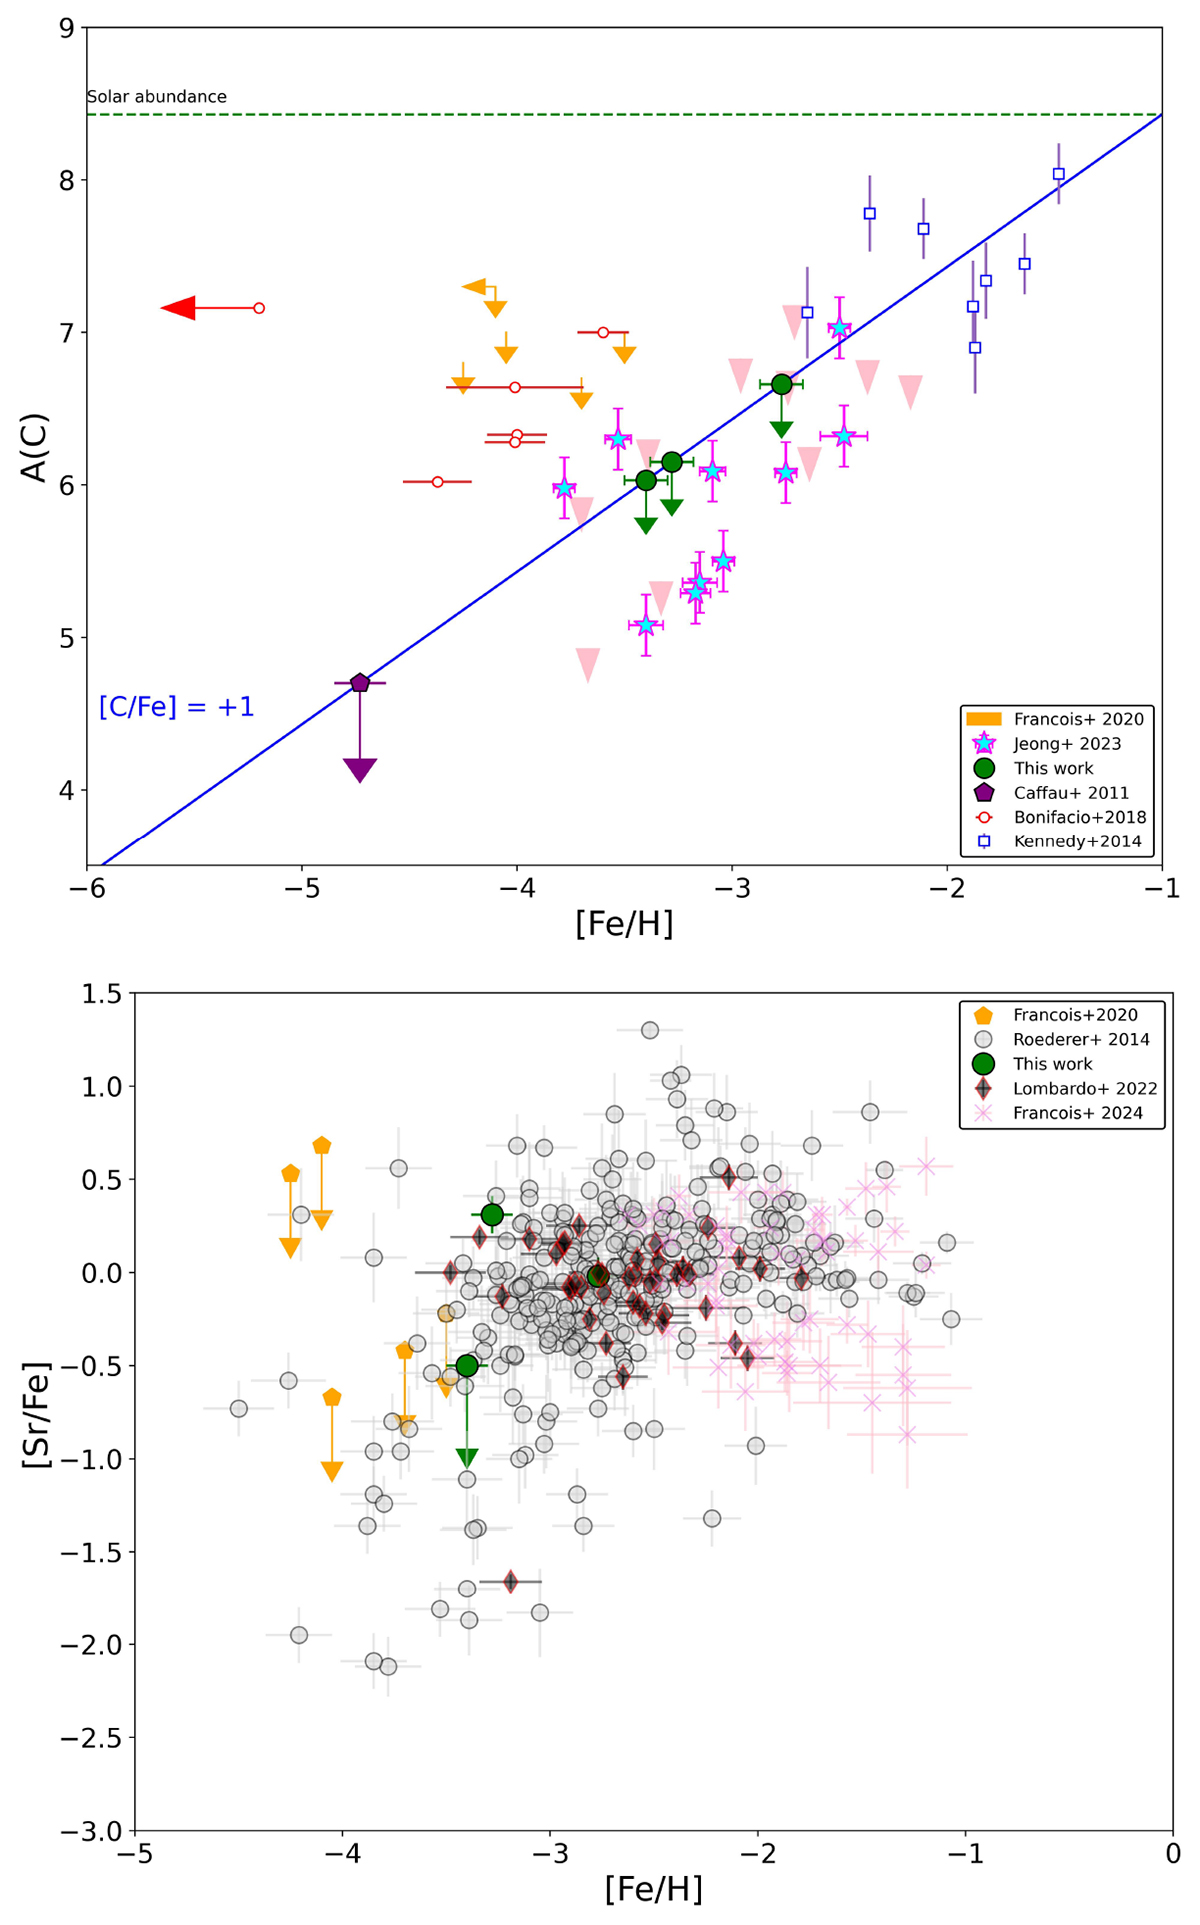
Carbon and Sr as a function of [Fe/H]. Upper panel: C abundances for our three EMP RRLs (green points) as a function of [Fe/H]. For comparison, we include also stars from Jeong et al. (2023), François et al. (2020), Bonifacio et al. (2018), Caffau et al. (2011), Kennedy et al. (2014). All abundances are in LTE; the blue solid line marks [C/Fe] = +1, see e.g. Beers & Christlieb (2005). Lower panel: [Sr/Fe] ratios vs. [Fe/H] for our RRLs along with literature samples (Roederer et al. 2014; François et al. 2020, 2024; Lombardo et al. 2022). We provide NLTE abundances as done by François et al. (2024), while LTE values were given by Roederer et al. (2014), François et al. (2020), Lombardo et al. (2022).
Current usage metrics show cumulative count of Article Views (full-text article views including HTML views, PDF and ePub downloads, according to the available data) and Abstracts Views on Vision4Press platform.
Data correspond to usage on the plateform after 2015. The current usage metrics is available 48-96 hours after online publication and is updated daily on week days.
Initial download of the metrics may take a while.