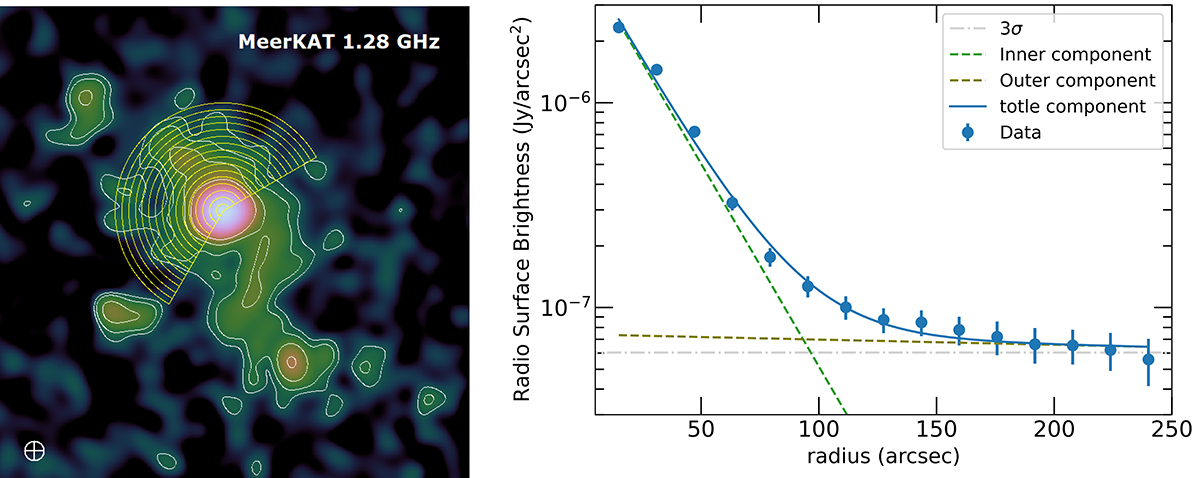
Fig. 4.
Download original image
Radio surface brightness distribution. Left: The region used to extract the surface brightness from the compact-source-subtracted low-resolution MeerKAT 1280 MHz image. Right: Radio surface brightness profile, with the solid line representing the best-fit result using a double exponential model. The two individual exponential components are shown as dashed lines, and the horizontal dash-dotted line indicates the 3σ in the compact-source-subtracted low-resolution MeerKAT image.
Current usage metrics show cumulative count of Article Views (full-text article views including HTML views, PDF and ePub downloads, according to the available data) and Abstracts Views on Vision4Press platform.
Data correspond to usage on the plateform after 2015. The current usage metrics is available 48-96 hours after online publication and is updated daily on week days.
Initial download of the metrics may take a while.