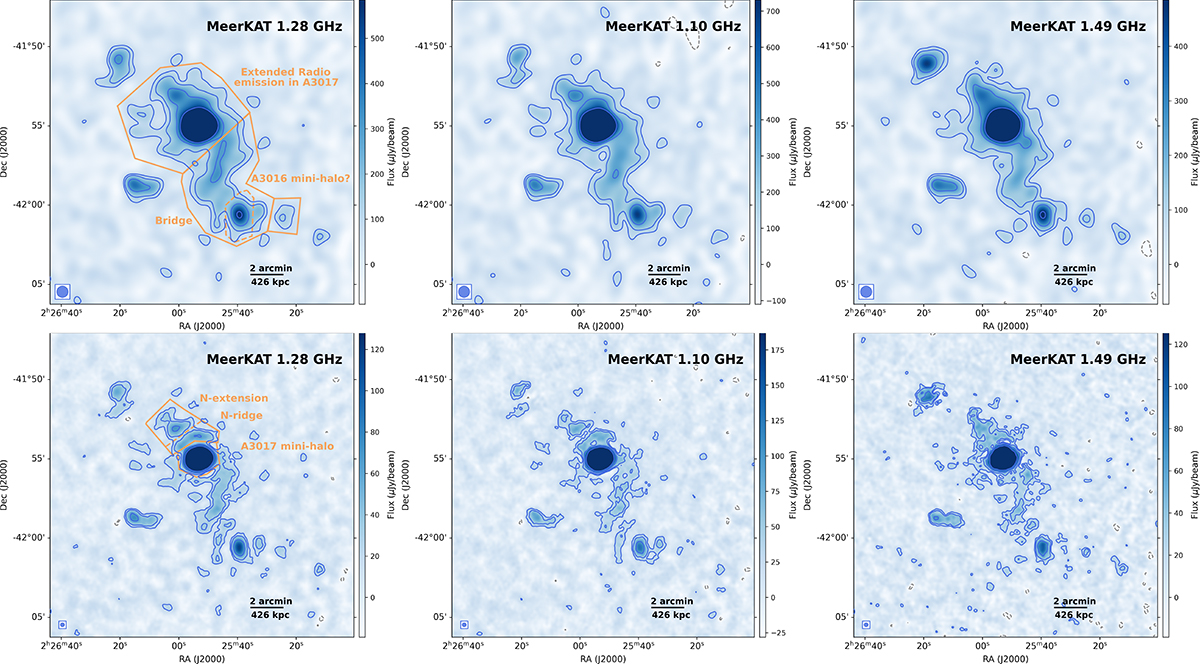
Fig. 3.
Download original image
Compact-source-subtracted MeerKAT images of diffuse radio emission at full-band and two subbands with central frequencies of 1.28 GHz, 1.10 GHz and 1.49 GHz, shown at low resolution (43″ × 43″, top) and at higher resolution (15″ × 15″, bottom). Contours show 3σ, 5σ, 10σ, and 20σ intensity levels. Negative −3σ contours are shown with grey dashed lines. The regions used for estimating the flux densities of each substructure are indicated.
Current usage metrics show cumulative count of Article Views (full-text article views including HTML views, PDF and ePub downloads, according to the available data) and Abstracts Views on Vision4Press platform.
Data correspond to usage on the plateform after 2015. The current usage metrics is available 48-96 hours after online publication and is updated daily on week days.
Initial download of the metrics may take a while.