Fig. 2.
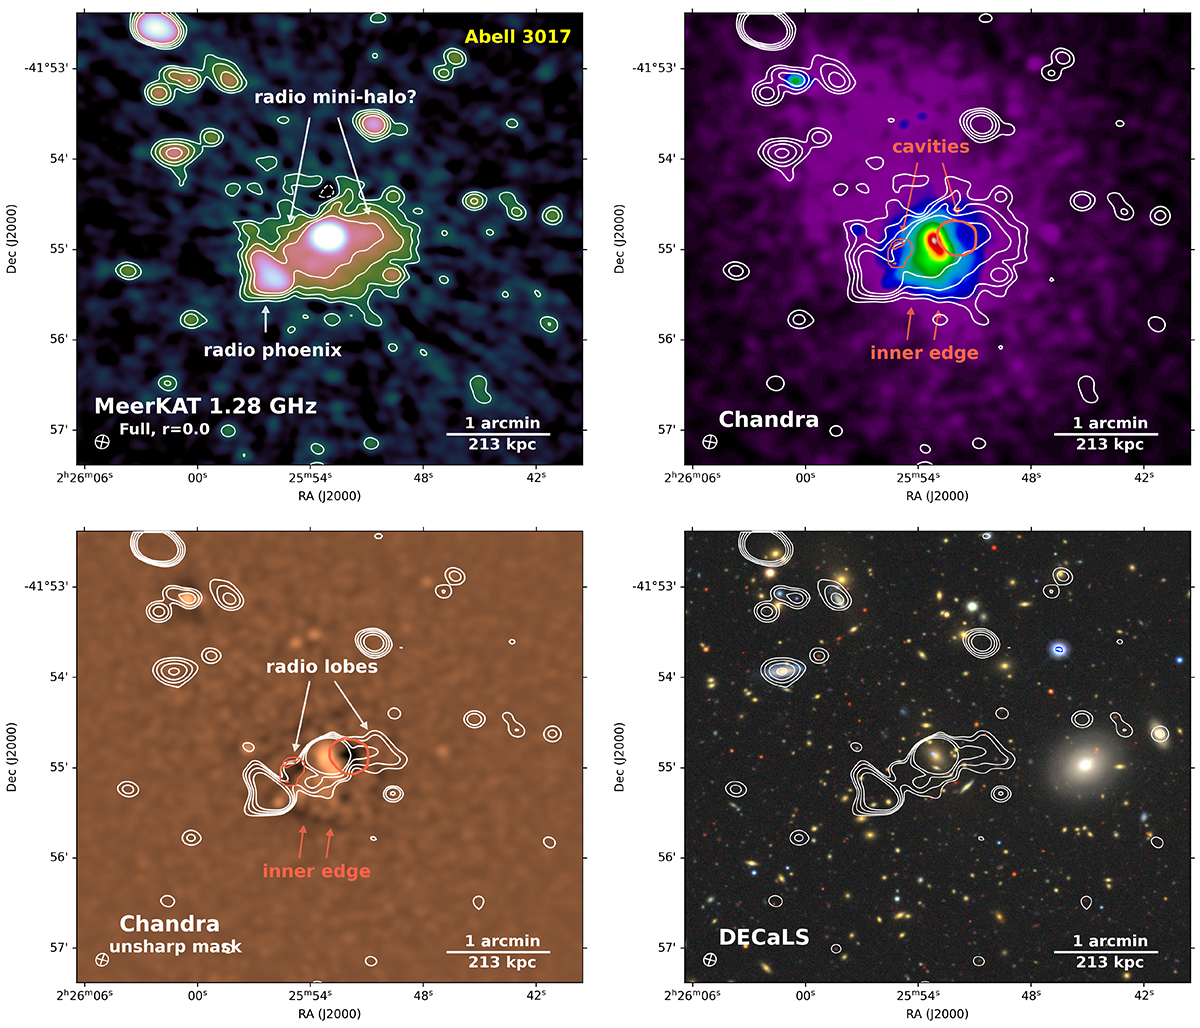
Download original image
Radio, X-ray, and optical images of the centre region of A3017. Top-left: Zoomed-in full-resolution MeerKAT 1280 MHz image with contour levels of [1, 2, 4, 8] × 5σ. Negative −3σ contours are shown with dotted lines. Top-right: Chandra 0.5–7.0 keV exposure-corrected image, overlaid with the same contours as in the top-left panel. The red contours represent a pair of X-ray cavities outlined by utilising the CAvity DEtection Tool (CADET; Plšek et al. 2024). An inner X-ray surface brightness edge induced by gas sloshing is also marked. Bottom-left: Chandra 0.5–7.0 keV unsharp-masked image, created by subtracting an image smoothed with a 2D Gaussian of 20 pixels from an image smoothed with a 2D Gaussian of 5 pixels. White contours refer to the MeerKAT image of the discrete sources obtained by setting an inner uv-cut of 3437λ (corresponding to ∼1′ or 213 kpc) and show 5σ, 10σ, 20σ, and 40σ intensity levels (σ = 7.55 × 10⁻⁶ Jy beam−1). Right: Composite DECalS optical image using g-, r-, and z-band data, overlaid with the same contours as in the bottom-left panel.
Current usage metrics show cumulative count of Article Views (full-text article views including HTML views, PDF and ePub downloads, according to the available data) and Abstracts Views on Vision4Press platform.
Data correspond to usage on the plateform after 2015. The current usage metrics is available 48-96 hours after online publication and is updated daily on week days.
Initial download of the metrics may take a while.