Fig. 10.
Download original image
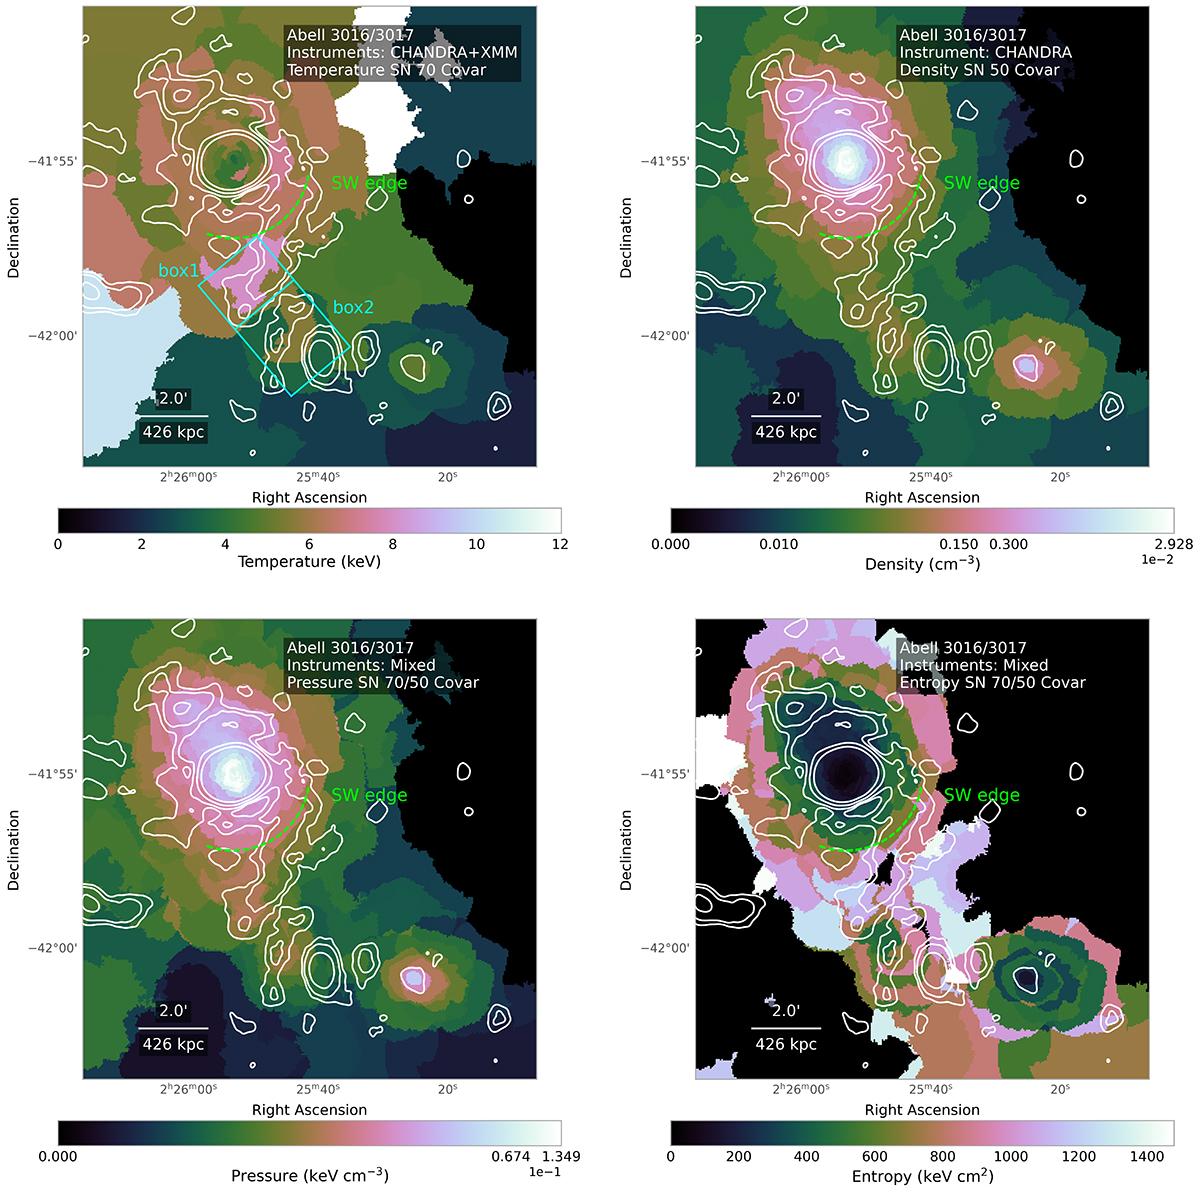
Two-dimensional projected thermodynamic maps of temperature (top-left), electron density (top-right), pressure (bottom-left), and entropy (bottom-right). The temperature map was created using binning with an S/N of 70, and the electron density map was created using binning with an S/N of 50. The pressure and entropy maps were created using the maps from temperature and electron density. The SW edge is marked, and the contours of the diffuse radio emission at high resolution are overlaid. Box regions used for estimating the temperature of the X-ray bridge are also indicated.
Current usage metrics show cumulative count of Article Views (full-text article views including HTML views, PDF and ePub downloads, according to the available data) and Abstracts Views on Vision4Press platform.
Data correspond to usage on the plateform after 2015. The current usage metrics is available 48-96 hours after online publication and is updated daily on week days.
Initial download of the metrics may take a while.