Open Access
Fig. 3
Download original image
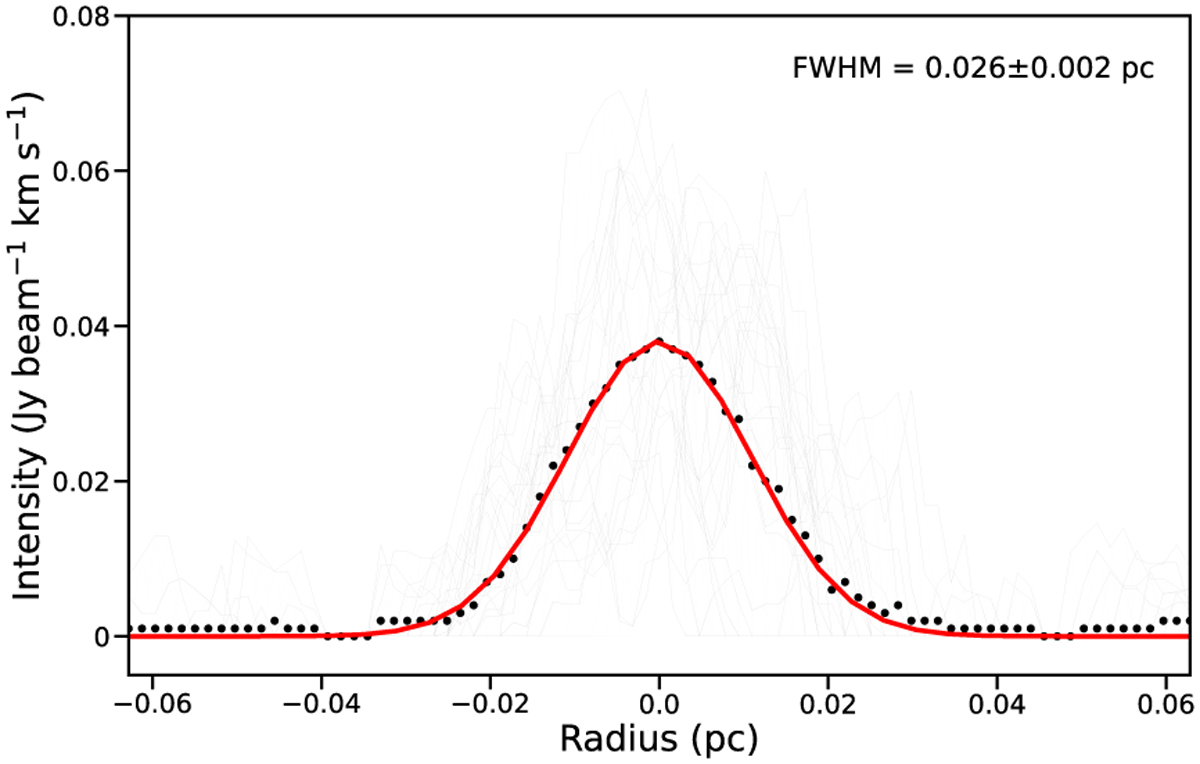
Mean radial intensity profile perpendicular to the filaments. Individual integrated intensity profiles are shown in gray, while the mean values are shown with black dots. The radius is the projected distance from the gas filament. The red solid line presents the best-fit result of Gaussian fitting.
Current usage metrics show cumulative count of Article Views (full-text article views including HTML views, PDF and ePub downloads, according to the available data) and Abstracts Views on Vision4Press platform.
Data correspond to usage on the plateform after 2015. The current usage metrics is available 48-96 hours after online publication and is updated daily on week days.
Initial download of the metrics may take a while.