| Issue |
A&A
Volume 694, February 2025
|
|
|---|---|---|
| Article Number | L13 | |
| Number of page(s) | 3 | |
| Section | Letters to the Editor | |
| DOI | https://doi.org/10.1051/0004-6361/202453133 | |
| Published online | 13 February 2025 | |
Letter to the Editor
New insights with XRISM and Cloudy: A novel column density diagnostic
1
Space Telescope Science Institute, 3700 San Martin Drive, Baltimore, MD 21218, USA
2
Royal Observatory of Belgium, Ringlaan 3, B-1180 Brussels, Belgium
3
Institute of Space and Astronautical Science (ISAS), Japan Aerospace Exploration Agency (JAXA), 3-1-1 Yoshinodai, Chuo-ku, Sagamihara, Kanagawa 252-5210, Japan
4
University of Kentucky, 506 Library Drive, Lexington, KY 40506, USA
⋆ Corresponding author; cgunasekera@stsci.edu
Received:
22
November
2024
Accepted:
18
January
2025
Aims. We present a simple yet powerful column density diagnostic for plasmas enabled by X-ray microcalorimeter observations.
Methods. With the recent developments of the spectral simulation code CLOUDY, inspired by the high spectral resolution of the X-Ray Imaging and Spectroscopy Mission (XRISM) and the Advanced Telescope for High Energy Astrophysics (Athena), we make predictions for the intensity ratio of the resolved fine-structure lines Lyα1 and Lyα2 of H-like ions.
Results. We show that this ratio can be observationally constrained and used as a plasma column density indicator. We demonstrate this with an XRISM observation of the high-mass X-ray binary Centaurus X-3.
Conclusions. This diagnostic is useful for a wide range of X-ray emitting plasmas that are either collisionally or radiatively ionized.
Key words: atomic processes / radiative transfer / X-rays: binaries
© The Authors 2025
 Open Access article, published by EDP Sciences, under the terms of the Creative Commons Attribution License (https://creativecommons.org/licenses/by/4.0), which permits unrestricted use, distribution, and reproduction in any medium, provided the original work is properly cited.
This article is published in open access under the Subscribe to Open model. Subscribe to A&A to support open access publication.
1. Introduction
The spectral resolution is a primary limiting factor in studying the hottest phenomena in the Universe. The X-Ray Imaging and Spectroscopy Mission (XRISM; Tashiro et al. 2020) was launched in 2023 and is poised to unlock new insights into the fundamental nature of the X-ray universe, with its dedicated Resolve microcalorimeter spectrograph (Ishisaki et al. 2022). However, we will need new tools to fully use the XRISM data as they will be able to resolve many spectral features for the first time. One of these features is the fine-structure doublet of the Lyman α line of H-like ions; that is, the 2p 2P3/2 → 1s  and 2p 2P1/2 → 1s
  transitions. We hereafter call them Lyα1 and Lyα2 and discuss their line-intensity ratio.
CLOUDY (last reviewed by Chatzikos et al. 2023; Gunasekera et al. 2023) is one of the most widely used spectral simulation codes for plasmas in nonlocal thermodynamic equilibrium. CLOUDY handles one- and two-electron systems with a consistent method along iso-sequences. The two-electron iso-sequence with optical emission lines was expanded by Porter et al. (2012, 2013), while the code uses atomic databases for the many-electron systems (Lykins et al. 2015; Gunasekera et al. 2022). Recent work by Gunasekera et al. (2024) has expanded the one-electron systems to simulate X-ray spectra that match the resolution of current and future microcalorimeter observations. The detailed microphysics required to resolve the Lyman series doublet at the resolution of XRISM was presented by Gunasekera et al. (2024). This development will be the primary component of the CLOUDY 2025 release.
The resolving power (R) required to separate the Lyman series doublet is shown for abundant elements in Figure 1. The energy split of the fine-structure levels stems from the spin-orbit coupling term of the Hamiltonian, which increases as a function of the atomic number (Z) at a rate ΔE ∝ Z4. As detailed in Gunasekera et al. (2024), the required resolving power R = E/ΔE ∝ Z−2 becomes less demanding for higher- Z elements. All high-resolution X-ray spectrometers before XRISM, that is, the Chandra Low and the High Energy Transmission Gratings (LETG, Brinkman et al. 2000; HETG, Canizares et al. 2005) and the Reflection Grating Spectrometer (RGS) (Den Herder et al. 2001) on board the X-ray Multi-Mirror Mission Newton (XMM-Newton), are based on dispersion spectrometry, which has a spectral resolution that is approximately constant in wavelengths Δλ, thus R = λ/Δλ ∝ E−1 ∝ Z−2. The resolution of the dispersion spectrometers and that required to resolve fine-structure levels depend on E in the same way by coincidence. As a result, none of the Lyman series doublets for any Z was resolved by these spectrometers.
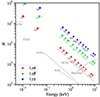 |
Fig. 1. Required resolving power (R ≡ E/ΔE) for separating the Lyα1, 2 (red), β1, 2 (green), and γ1, 2 (blue) fine-structure doublets of major elements compared to the instrumental resolving power of the HST STIS (Kimble et al. 1998), FUSE (Moos et al. 2000), Chandra LETG (Brinkman et al. 2000) and HETG (Canizares et al. 2005), XMM-Newton RGS (Den Herder et al. 2001), and XRISM Resolve (Ishisaki et al. 2022) using the FWHM. The elements below the curves can be resolved with the spectrometer. The symbol size represents the logarithm of the solar abundance of the elements (Anders & Grevesse 1989). |
The X-ray microcalorimeter on board XRISM uses an entirely different spectroscopic technique based on nondispersive X-ray microcalorimetery, whose resolution is approximately constant in energy ΔE, thus R ∝ E1. For Z ≥ 18 (Ar), the Lyα doublet is resolved with XRISM for the first time for any astronomical source at a redshift of approximately zero, except for the Sun. It can even resolve the Lyβ doublet for Z ≥ 26 (Fe). This is also the case for other fine-structure levels such as the He-like ions x and y lines of the Heα (n = 2 → 1) transitions. For He-like ions, we denote w, x, y, and z for the  ,
,  ,
,  , and
, and  transitions, respectively, from the 1s2p or 1s2s levels to the 1s2 ground state.
In this Letter, we focus on the Lyα doublet. We show that the intensity ratio of the doublet is a useful diagnostic of the physical conditions of X-ray emitting plasmas. We present the theoretical predictions made by CLOUDY in Section 2 and apply the method to actual observational data with XRISM in Section 3.
2. Spectral simulations using Cloudy
We present a CLOUDY simulation for the plasma at the Perseus cluster core (Aharonian et al. 2016). This is one of the brightest galaxy clusters observed in X-rays and provides an ideal case to explore the physics. The model assumes a collisionally ionized plasma at a constant temperature of 4.7 × 10⁷ K and a hydrogen density of 10−1.5 cm−3 with a varying plasma thickness in the line of sight, evaluated as the H-equivalent column density (NH). We also included a microturbulent velocity of 150 km s−1 to ensure more realistic line shielding and pumping.
CLOUDY handles line radiative transport using a unified approach with the goal of having a single class (a group of objects in the code that share the same properties and behaviors) with the appropriate atomic parameters. The line transfer is handled within this framework. As summarized by Hummer (1962), four cases can be identified depending on the lifetimes of the upper and lower states and on the importance of Doppler and radiative broadening. Kalkofen (1987) gives further details. By default, CLOUDY assumes a partial redistribution for resonance lines and complete redistribution for subordinate lines. These assumptions can be changed with options in the user interface, although tests showed that these do not influence the conclusions presented here.
Figure 2 shows the change in the intensity ratio of the Lyα doublet as NH increases for some selected elements. Two simple limits are apparent. At low column densities, where the line optical depth is low, the line photons escape freely without interactions. CLOUDY Lyαj intensities are proportional to the populations of the upper levels, which are assumed to be proportional to their statistical weights (further discussed in Gunasekera et al. 2024). Hence the ratio is predicted to be 2:1, with the Lyα1 line being stronger. This is close to the value observed in the Fe XXVI doublet in the corona X-rays in the Sun, in which the lines are optically thin (Tanaka 1986).
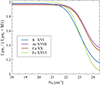 |
Fig. 2. Line-intensity ratio of the Lyα doublet for selected H-like ions as a function of the plasma column density calculated with CLOUDY. The absolute value of NH changes for different plasma environments, as the line optical depth is converted into NH using the chemical abundance, charge, and level populations of the simulation. CLOUDY provides Lyα2 + M1 as a blend for Fe XXVI only. For the other one-electron species, these line must be obtained separately in CLOUDY and summed by hand. |
As the optical depth increases, line photons undergo an increasing number of absorptions and reemissions before escaping. As a result, the photons we observe at Earth will have the physical conditions imprinted on them where they were last reemitted. In other words, the line flux is determined by the physical conditions at that point. More quantitatively, this can be understood by considering the Eddington-Barbier approximation, which states that the emergent flux is determined by the source function at the location at which the line optical depth τ reaches two-thirds when integrated from the observer’s point of view (Rutten 2003). Assuming the conditions are sufficiently similar in the regions in which the Lyα1 and Lyα2 lines reach τ = 2/3, the Lyα1/Lyα2 line ratio approaches 1:1 for high column densities. CLOUDY does not code the Eddington-Barbier approximation explicitly, but rather uses the escape probability formalism to compute the line fluxes. This should give very similar results, however. This implies that the Lyα doublet intensity ratio is sensitive to column densities in the range of ≈1020 − 1024 cm−2 with different ranges for different elements. This is the appropriate range observed in many systems.
3. Observational demonstration using XRISM
We demonstrate the proposed diagnostic using actual observation data with XRISM. We took Centaurus X-3 (Cen X-3) as an example. Cen X-3 is an eclipsing high-mass X-ray binary comprised of a neutron star (NS) and an O6.5 II-III star (Schreier et al. 1972). The X-ray spectra during eclipses are not contaminated by the direct emission from the NS, upon which absorption features are imprinted. Therefore, it is more suitable for the emission-line ratio diagnostics focusing on the diffuse emission from the photoionized plasma.
Cen X-3 was observed with Resolve on February 12–15, 2024 (sequence number 300003010; Mochizuki et al. 2024). Two eclipses were covered during the XRISM observation. We integrated the X-ray spectrum over the eclipses for 48 ks (Figure 3). The fine-structure levels in the Heα and Lyα complexes are indeed resolved. The Lyα line complex was fit using two Gaussian lines plus a power-law model to account for the underlying continuum. The line centers were fixed to the values in the APED database (Smith et al. 2001), but they were allowed to shift collectively to account for possible systematic velocities and energy gain calibration uncertainty. The line intensities were fit individually. The widths of the two lines (1 and 2) were assumed to be the same and were fit simultaneously. A successful fit was obtained with a reduced χ2 < 1.2 and the line ratio was derived as 1.35 ± 0.11.
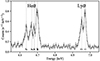 |
Fig. 3. Resolve spectrum of Cen X-3 during eclipse (Pradhan & Tsujimoto 2024) of the Fe XXV Heα and Fe XXVI Lyα complex. The fine-structure levels of the complexes are clearly resolved. |
We applied the diagnostics proposed in Section 2. We ran a CLOUDY simulation customized for Cen X-3. The photoionizing emission was provided by the NS, which is represented by a power law with a photon index of −1.8 and a luminosity LX = 1037 erg s−1 in the 1−1000 Ryd range as derived from the data. The emission lines from the photoionized plasma were observed when the NS was eclipsed by the O star, indicating that the plasma size is no smaller than the radius of the O star (12 R⊙). We thus set the inner radius to rin = 1012 cm. The ionization parameter log ξ ∼ 4 from the line-intensity ratio of H-like versus He-like ions. These yield the electron density  cm−3. We assumed a plane-parallel geometry. The turbulent velocity was set to zero. Figure 4 shows the result. We constrained the hydrogen-equivalent column density of the plasma to be ∼2 × 1022 cm−2. This is consistent with other methods such as the Heαz/w ratio (Chakraborty et al. 2021) within a factor of a few, and it verifies the validity of this diagnostic.
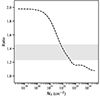 |
Fig. 4. Lyα1/Lyα2 ratio calculated with CLOUDY for the Cen X-3 setting (dashed curve) and the observed ratio (shaded area). Though minor for this setup, the M1 transition (2s) |


4. Summary
The present study highlights the groundbreaking potential for new science that can be uncovered by using the latest CLOUDY developments to understand microcalorimeter observations. The column thickness in the line of sight is a crucial quantifier of the X-ray emitting plasma in all systems. We presented a novel column density diagnostic using the intensity ratio of the resolved Lyα doublet of one-electron atoms, which changes from 2 to 1 as the optical thickness of the line center increases as NH increases. Different elements are sensitive to different ranges of the NH based on variations in their abundance, charge, level populations, oscillator strength, line profiles, and so on, all of which are taken into account in CLOUDY simulations. We demonstrated this for Cen X-3 using the Fe XXVI Lyα doublet resolved with XRISM data and the CLOUDY simulation, and we constrained its NH value.
Data availability
All CLOUDY models and subsequent figures used in the present paper are available at https://gitlab.nublado.org/cloudy/papers/-/tree/main/arXiv.2411.15357
Acknowledgments
CMG and GJF were supported by JWST-AR-06419 and JWST-AR-06428. This research made use of the JAXA’s high-performance computing system JSS3.
References
- Aharonian, F., Akamatsu, H., Akimoto, F., et al. 2016, Nature, 535, 117 [CrossRef] [Google Scholar]
- Anders, E., & Grevesse, N. 1989, Geochim. Cosmochim. Acta, 53, 197 [Google Scholar]
- Brinkman, A. C., Gunsing, T., Kaastra, J. S., et al. 2000, Proc. SPIE, 4012, 81 [CrossRef] [Google Scholar]
- Canizares, C. R., Davis, J. E., Dewey, D., et al. 2005, PASP, 117, 1144 [NASA ADS] [CrossRef] [Google Scholar]
- Chakraborty, P., Ferland, G. J., Chatzikos, M., Guzmán, F., & Su, Y. 2021, ApJ, 912, 26 [NASA ADS] [CrossRef] [Google Scholar]
- Chatzikos, M., Bianchi, S., Camilloni, F., et al. 2023, Rev. Mex. Astron. Astrofis., 59, 327 [Google Scholar]
- Den Herder, J. W., Brinkman, A. C., Kahn, S. M., et al. 2001, A&A, 365, L7 [NASA ADS] [CrossRef] [EDP Sciences] [Google Scholar]
- Gunasekera, C. M., Chatzikos, M., & Ferland, G. J. 2022, Astronomy, 1, 255 [NASA ADS] [CrossRef] [Google Scholar]
- Gunasekera, C. M., van Hoof, P. A. M., Chatzikos, M., & Ferland, G. J. 2023, Res. Notes Am. Astron. Soc., 7, 246 [Google Scholar]
- Gunasekera, C. M., van Hoof, P. A. M., Chatzikos, M., & Ferland, G. J. 2024, ArXiv e-prints [arXiv:2412.01606] [Google Scholar]
- Hummer, D. G. 1962, MNRAS, 125, 21 [Google Scholar]
- Ishisaki, Y., Kelley, R. L., Awaki, H., et al. 2022, Proc. SPIE, 12181, 409 [Google Scholar]
- Kalkofen, W. 1987, Numerical Radiative Transfer (Cambridge: Cambridge University Press) [Google Scholar]
- Kimble, R. A., Woodgate, B. E., Bowers, C. W., et al. 1998, ApJ, 492, L83 [NASA ADS] [CrossRef] [Google Scholar]
- Lykins, M. L., Ferland, G. J., Kisielius, R., et al. 2015, ApJ, 807, 118 [NASA ADS] [CrossRef] [Google Scholar]
- Mochizuki, Y., Tsujimoto, M., Kelley, R. L., et al. 2024, ApJ, 977, L21 [NASA ADS] [CrossRef] [Google Scholar]
- Moos, H. W., Cash, W. C., Cowie, L. L., et al. 2000, ApJ, 538, L1 [NASA ADS] [CrossRef] [Google Scholar]
- Porter, R. L., Ferland, G. J., Storey, P. J., & Detisch, M. J. 2012, MNRAS, 425, L28 [NASA ADS] [Google Scholar]
- Porter, R. L., Ferland, G. J., Storey, P. J., & Detisch, M. J. 2013, MNRAS, 433, L89 [NASA ADS] [CrossRef] [Google Scholar]
- Pradhan, P., & Tsujimoto, M. 2024, Bulletin de la Société Royale des Sciences de Liège, 93, 283 [Google Scholar]
- Rutten, R. J. 2003, Radiative Transfer in Stellar Atmospheres, 255 [Google Scholar]
- Schreier, E., Levinson, R., Gursky, H., et al. 1972, ApJ, 172, L79 [NASA ADS] [CrossRef] [Google Scholar]
- Smith, R. K., Brickhouse, N. S., Liedahl, D. A., & Raymond, J. C. 2001, ApJ, 556, L91 [Google Scholar]
- Tanaka, K. 1986, PASJ, 38, 225 [NASA ADS] [Google Scholar]
- Tashiro, M. S., Maejima, H., Toda, K., et al. 2020, Proc. SPIE, 11444, 176 [Google Scholar]
All Figures
|
Fig. 1. Required resolving power (R ≡ E/ΔE) for separating the Lyα1, 2 (red), β1, 2 (green), and γ1, 2 (blue) fine-structure doublets of major elements compared to the instrumental resolving power of the HST STIS (Kimble et al. 1998), FUSE (Moos et al. 2000), Chandra LETG (Brinkman et al. 2000) and HETG (Canizares et al. 2005), XMM-Newton RGS (Den Herder et al. 2001), and XRISM Resolve (Ishisaki et al. 2022) using the FWHM. The elements below the curves can be resolved with the spectrometer. The symbol size represents the logarithm of the solar abundance of the elements (Anders & Grevesse 1989). |
| In the text | |
|
Fig. 2. Line-intensity ratio of the Lyα doublet for selected H-like ions as a function of the plasma column density calculated with CLOUDY. The absolute value of NH changes for different plasma environments, as the line optical depth is converted into NH using the chemical abundance, charge, and level populations of the simulation. CLOUDY provides Lyα2 + M1 as a blend for Fe XXVI only. For the other one-electron species, these line must be obtained separately in CLOUDY and summed by hand. |
| In the text | |
|
Fig. 3. Resolve spectrum of Cen X-3 during eclipse (Pradhan & Tsujimoto 2024) of the Fe XXV Heα and Fe XXVI Lyα complex. The fine-structure levels of the complexes are clearly resolved. |
| In the text | |
|
Fig. 4. Lyα1/Lyα2 ratio calculated with CLOUDY for the Cen X-3 setting (dashed curve) and the observed ratio (shaded area). Though minor for this setup, the M1 transition (2s) |
| In the text | |
Current usage metrics show cumulative count of Article Views (full-text article views including HTML views, PDF and ePub downloads, according to the available data) and Abstracts Views on Vision4Press platform.
Data correspond to usage on the plateform after 2015. The current usage metrics is available 48-96 hours after online publication and is updated daily on week days.
Initial download of the metrics may take a while.