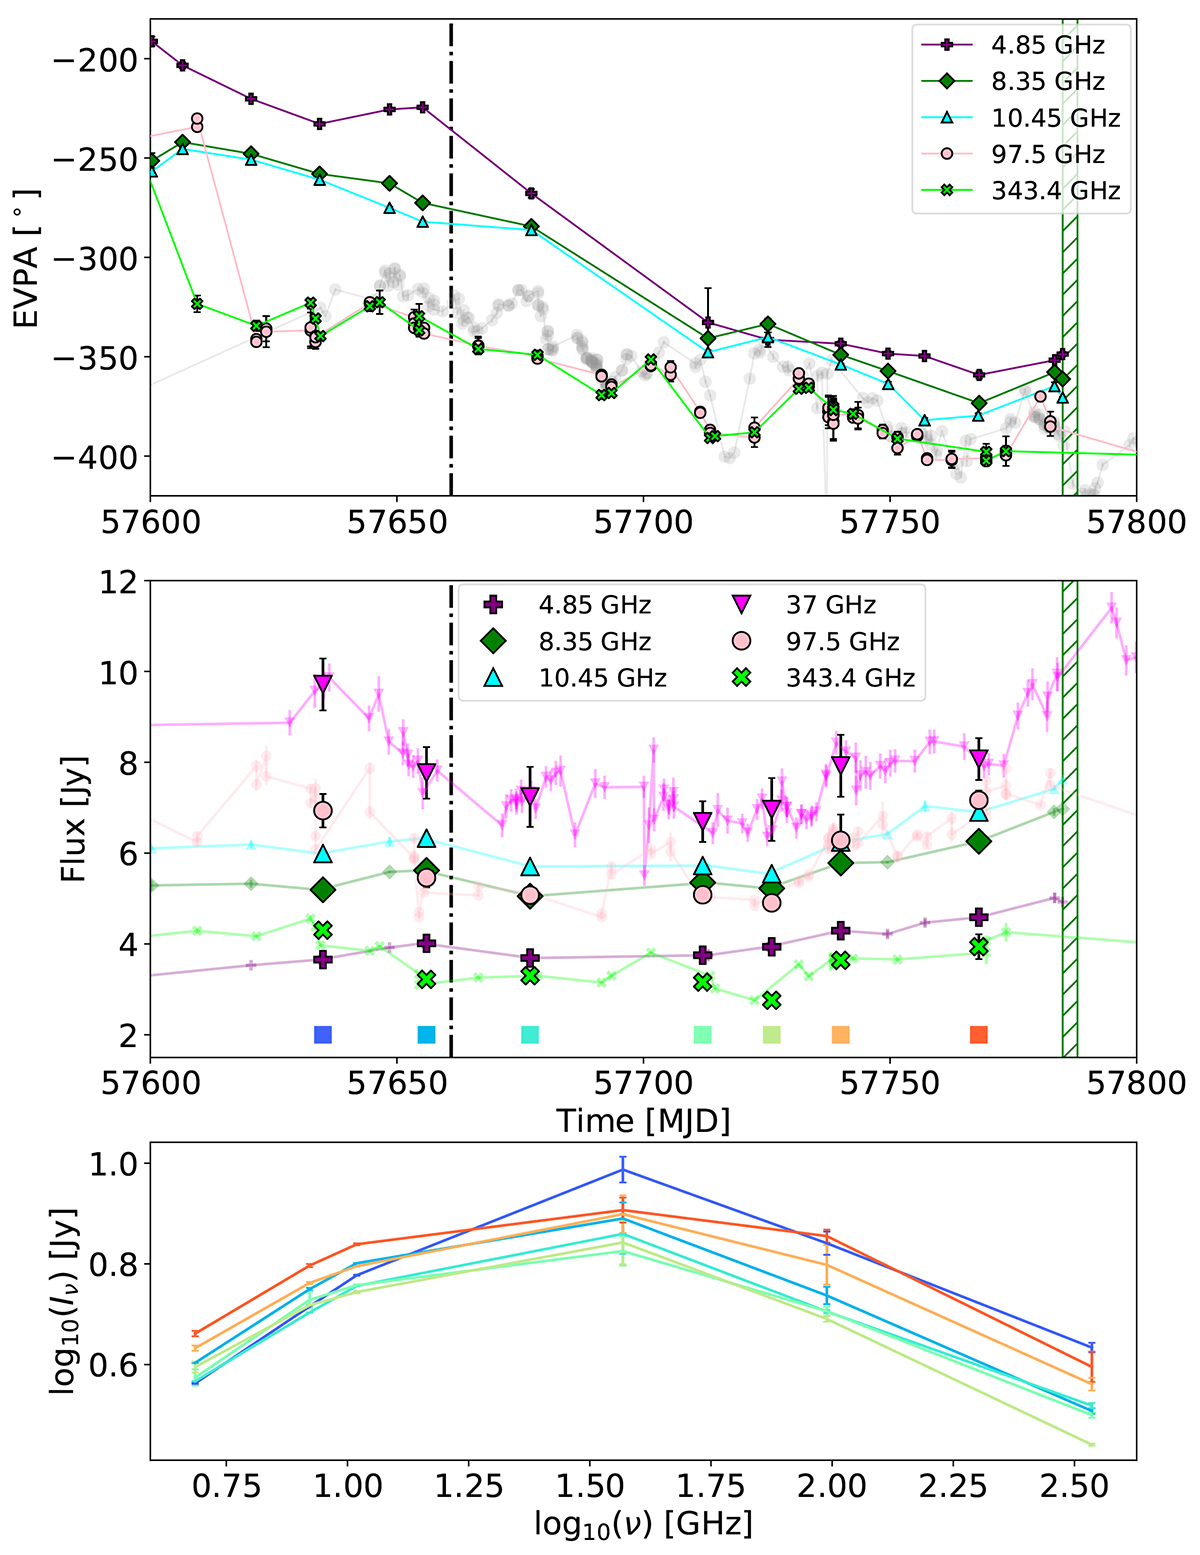
Fig. 4.
Download original image
Evolution of the EVPA in different frequencies and simultaneous light curves and spectral behaviour. Top panel: EVPA curves of 4.85, 8.35, 10.45, 97.5, and 343.4 GHz. The optical data are shown in grey. The dot-dashed black line shows the epoch when S1 was detected brightened in the GMVA 86 GHz images. The green hatched area shows the epoch of the February 2017 VHE flare. Middle panel: light curves of 4.85, 8.35, 10.45, 37, 97.5, and 343.4 GHz bands from the period MJD 57600–57800. Similar to Fig. 3, the data were re-binned with a weekly cadence and averaged. Highlighted data points show the selected averaged bins of each light curve. Bottom panel: time evolution of the spectrum; the order of time is colour-coded based on the coloured patches in the top panel.
Current usage metrics show cumulative count of Article Views (full-text article views including HTML views, PDF and ePub downloads, according to the available data) and Abstracts Views on Vision4Press platform.
Data correspond to usage on the plateform after 2015. The current usage metrics is available 48-96 hours after online publication and is updated daily on week days.
Initial download of the metrics may take a while.