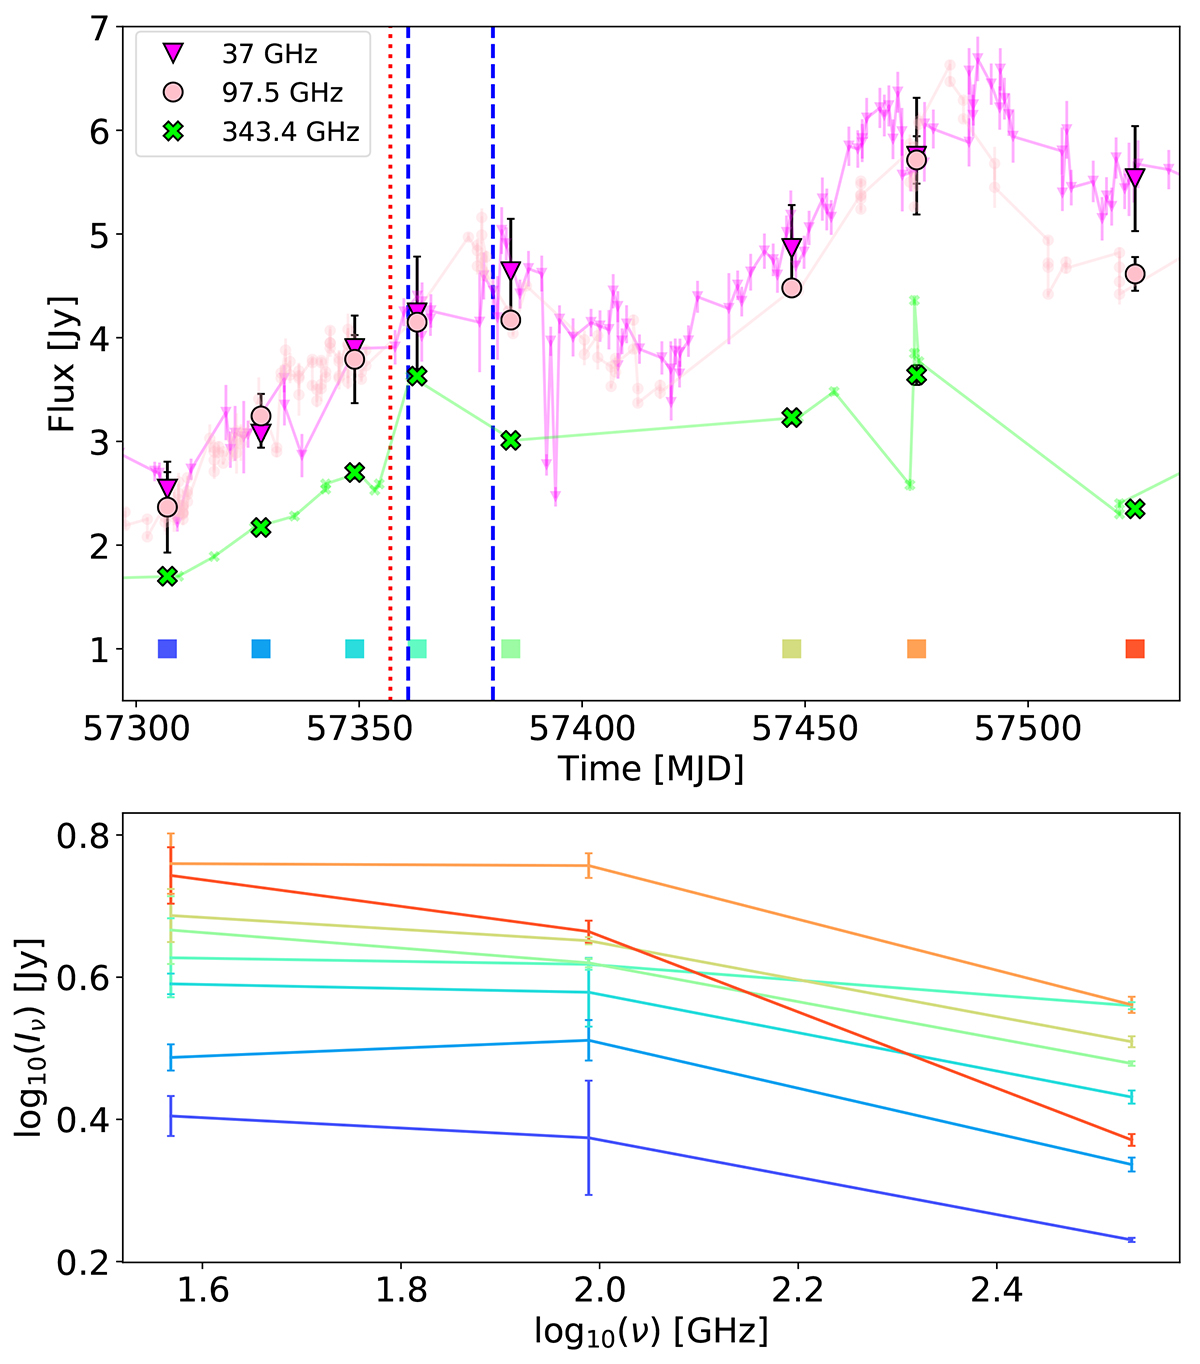
Fig. 3.
Download original image
Light curves and spectral behaviour of OJ 287 at the time of the GR flares. Top panel: light curves of 37, 97.5, and 343.4 GHz bands from the period MJD 57300–57550. To construct the spectra, the data were re-binned with a weekly cadence and averaged. Highlighted data points show the selected averaged bins of each light curve. The dotted red line shows the time when K was within the 86 GHz core. The two dashed blue lines show the times of the 2015 GR flares. Bottom panel: time evolution of the spectrum. The order of time is colour-coded based on the coloured patches in the top panel.
Current usage metrics show cumulative count of Article Views (full-text article views including HTML views, PDF and ePub downloads, according to the available data) and Abstracts Views on Vision4Press platform.
Data correspond to usage on the plateform after 2015. The current usage metrics is available 48-96 hours after online publication and is updated daily on week days.
Initial download of the metrics may take a while.