Fig. 2.
Download original image
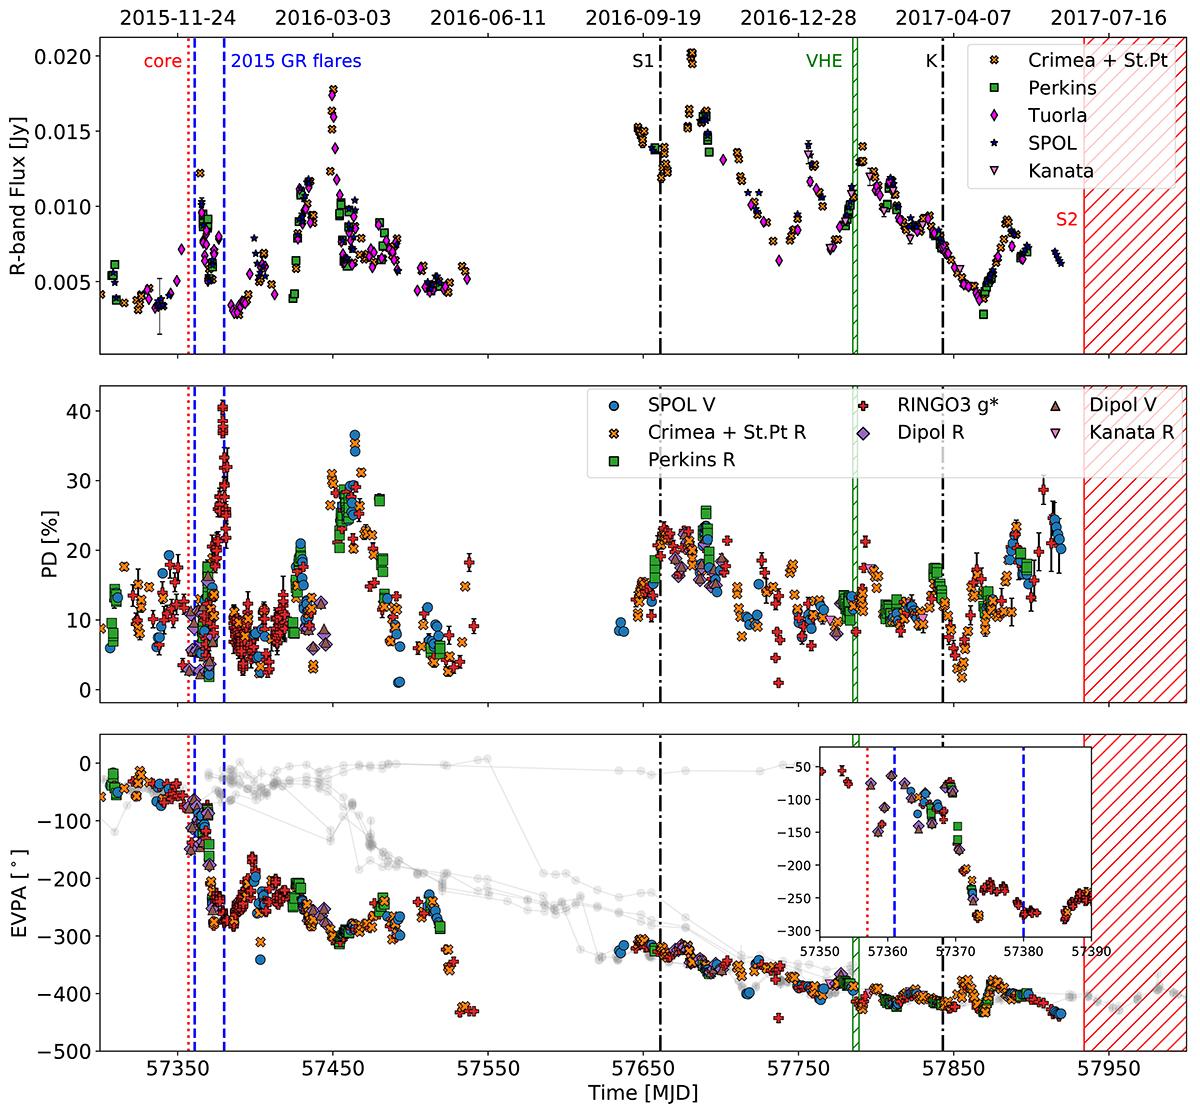
Light curves displaying the R-band flux and combined R-, V- and g*-band PD and EVPA evolution. The inset shows a zoomed-in view of the ∼210° rotation seen in the optical data. The grey data points in the bottom panel show the evolution of the radio band (as shown in Fig. 1) for contrast. The vertical lines and hatched areas are as explained in Fig. 1 (see details in Sects. 3 and 4).
Current usage metrics show cumulative count of Article Views (full-text article views including HTML views, PDF and ePub downloads, according to the available data) and Abstracts Views on Vision4Press platform.
Data correspond to usage on the plateform after 2015. The current usage metrics is available 48-96 hours after online publication and is updated daily on week days.
Initial download of the metrics may take a while.