Fig. 1.
Download original image
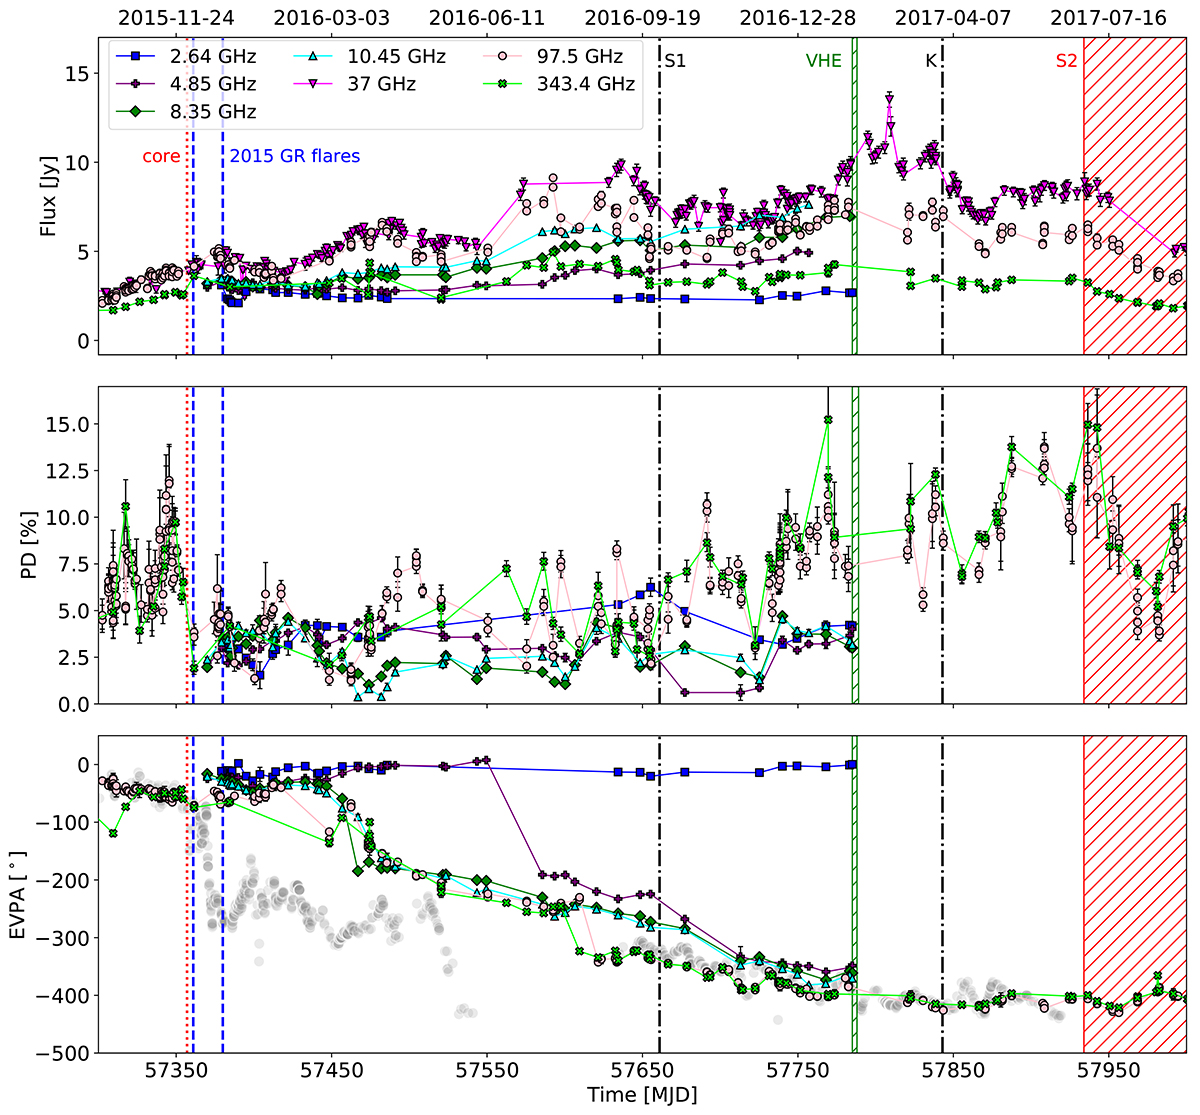
Light curves displaying the multi-frequency radio flux, PD, and EVPA evolution. Starting from MJD 57586, the EVPA data at 4.85 GHz have been shifted by 180° for better comparison with the higher frequencies. The grey data points in the bottom panel show the evolution of the optical data (shown in Fig. 2) for contrast. The vertical dashed blue lines mark the times of the optical flares predicted by the GR model. The vertical dot-dashed black lines mark the GMVA epochs when quasi-stationary feature S1 was seen brightened and when the moving component K was detected. The green hatched area marks the period of VHE flaring. The vertical dotted red line marks the time when K should have still been residing within the millimetre-radio band core, and the red hatched area the estimated time when K reached quasi-stationary feature S2 (see details in Sects. 3 and 4).
Current usage metrics show cumulative count of Article Views (full-text article views including HTML views, PDF and ePub downloads, according to the available data) and Abstracts Views on Vision4Press platform.
Data correspond to usage on the plateform after 2015. The current usage metrics is available 48-96 hours after online publication and is updated daily on week days.
Initial download of the metrics may take a while.