Fig. 6
Download original image
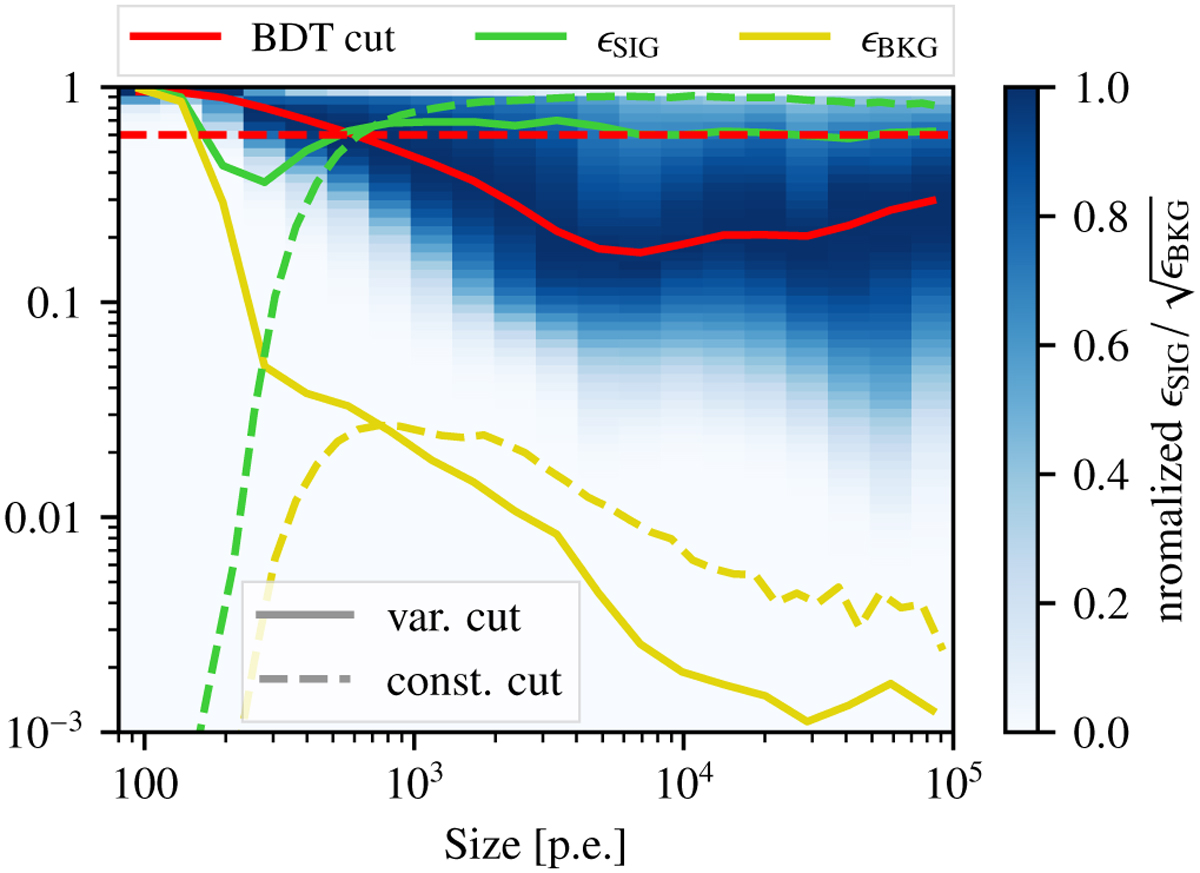
Scan of q-factors for different event sizes (x-axis) and BDT cuts (y-axis) using the 6 Hillas variables. For each size bin the color map shows the q-factors (normalized to 1) for different BDT cuts. The resulting optimal BDT cut (red) is shown together with the signal (green) and background (yellow) background efficiencies. The solid lines show the case for the size-dependent BDT cut while the dashed lines show the constant BDT cut.
Current usage metrics show cumulative count of Article Views (full-text article views including HTML views, PDF and ePub downloads, according to the available data) and Abstracts Views on Vision4Press platform.
Data correspond to usage on the plateform after 2015. The current usage metrics is available 48-96 hours after online publication and is updated daily on week days.
Initial download of the metrics may take a while.