Fig. 15
Download original image
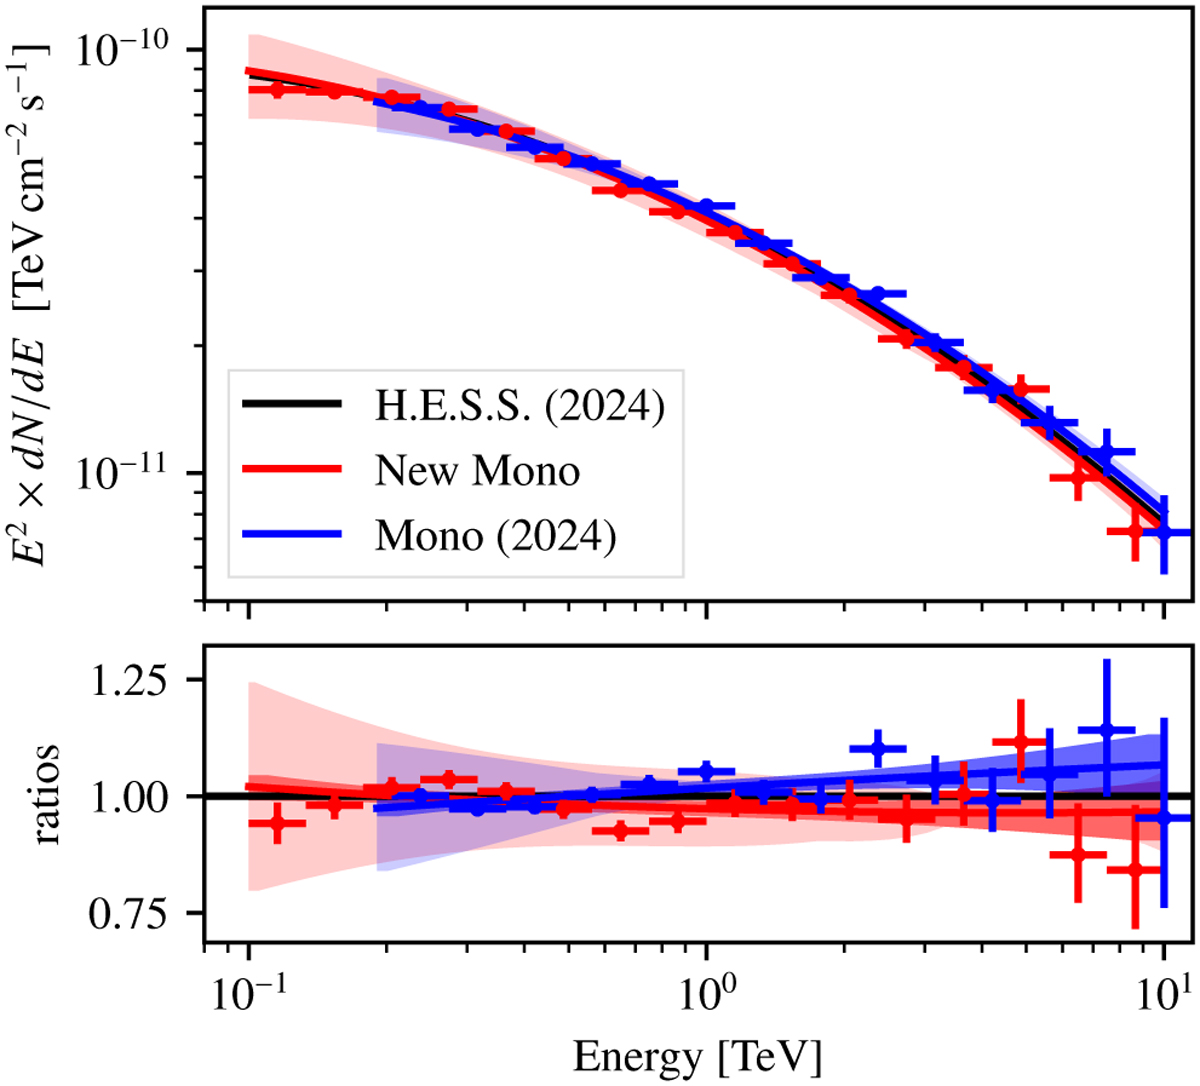
Spectral energy distribution of the Crab Nebula as measured by CT5. The blue data points correspond to the H.E.S.S. mono data from Aharonian et al. (2024), reflecting the performance of the standard reconstruction method. The black line represents the Crab spectrum obtained from the mono + stereo analysis (extrapolated to 100 GeV) also from Aharonian et al. (2024). The red data points indicate the results from the new reconstruction method. In the upper panel, the shaded error bands represent the combined statistical and systematic uncertainties. The lower panel illustrates the ratios relative to the black spectrum, with the darker shaded regions showing the statistical uncertainty in addition to the total uncertainty.
Current usage metrics show cumulative count of Article Views (full-text article views including HTML views, PDF and ePub downloads, according to the available data) and Abstracts Views on Vision4Press platform.
Data correspond to usage on the plateform after 2015. The current usage metrics is available 48-96 hours after online publication and is updated daily on week days.
Initial download of the metrics may take a while.