Fig. 14
Download original image
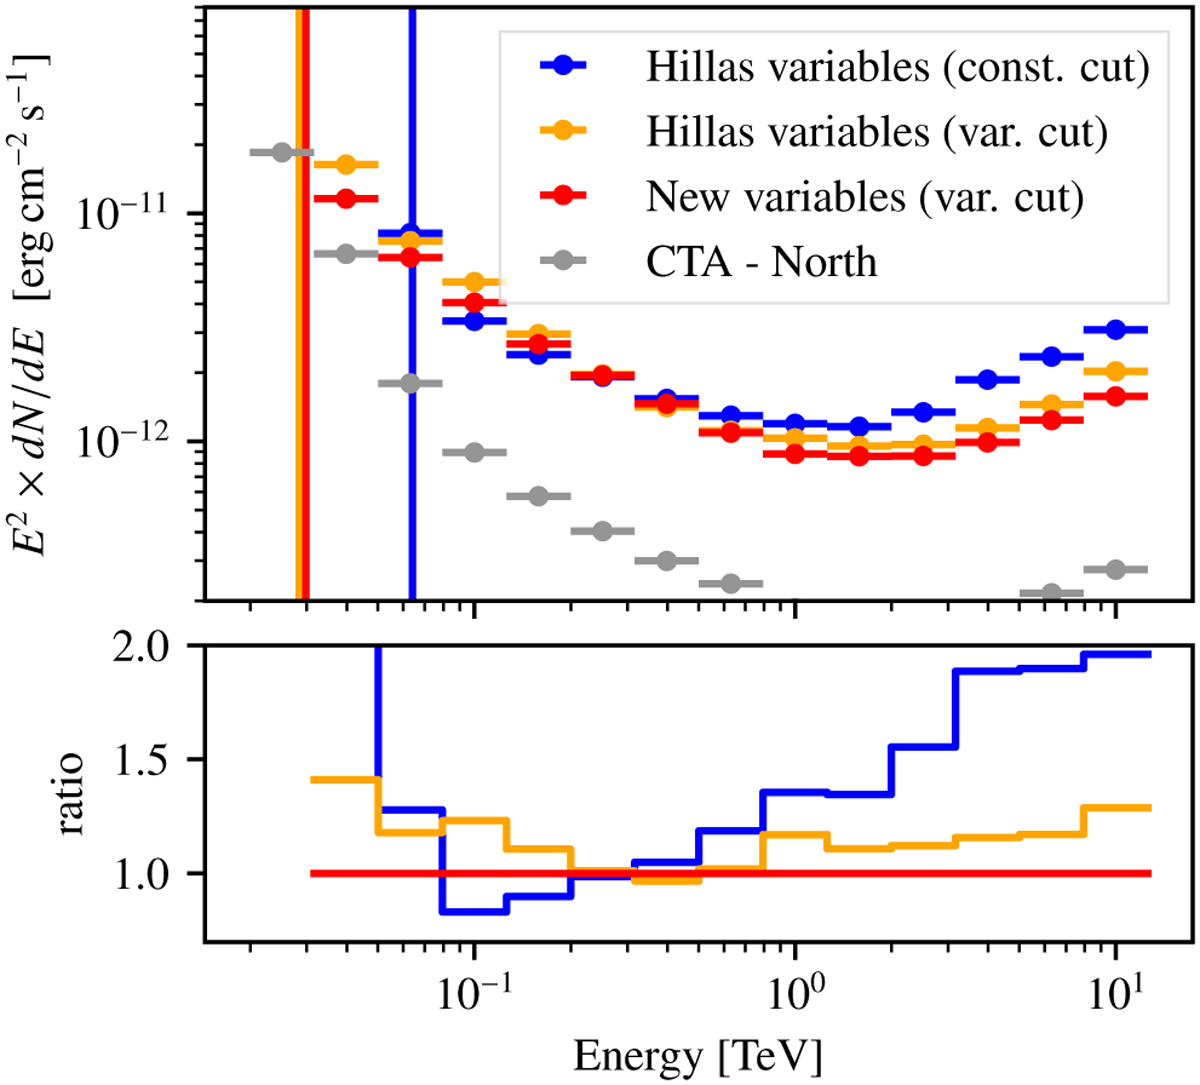
Comparison of the differential sensitivities (upper panel) and their ratios (lower panel). The vertical lines show the energy threshold at which the effective area drops below 10% of its maximum. The sensitivities are computed for 50 h of observation time and 5σ detection per energy bin. The points for CTA - North rely on prod5 v0.1 IRFs5.
Current usage metrics show cumulative count of Article Views (full-text article views including HTML views, PDF and ePub downloads, according to the available data) and Abstracts Views on Vision4Press platform.
Data correspond to usage on the plateform after 2015. The current usage metrics is available 48-96 hours after online publication and is updated daily on week days.
Initial download of the metrics may take a while.