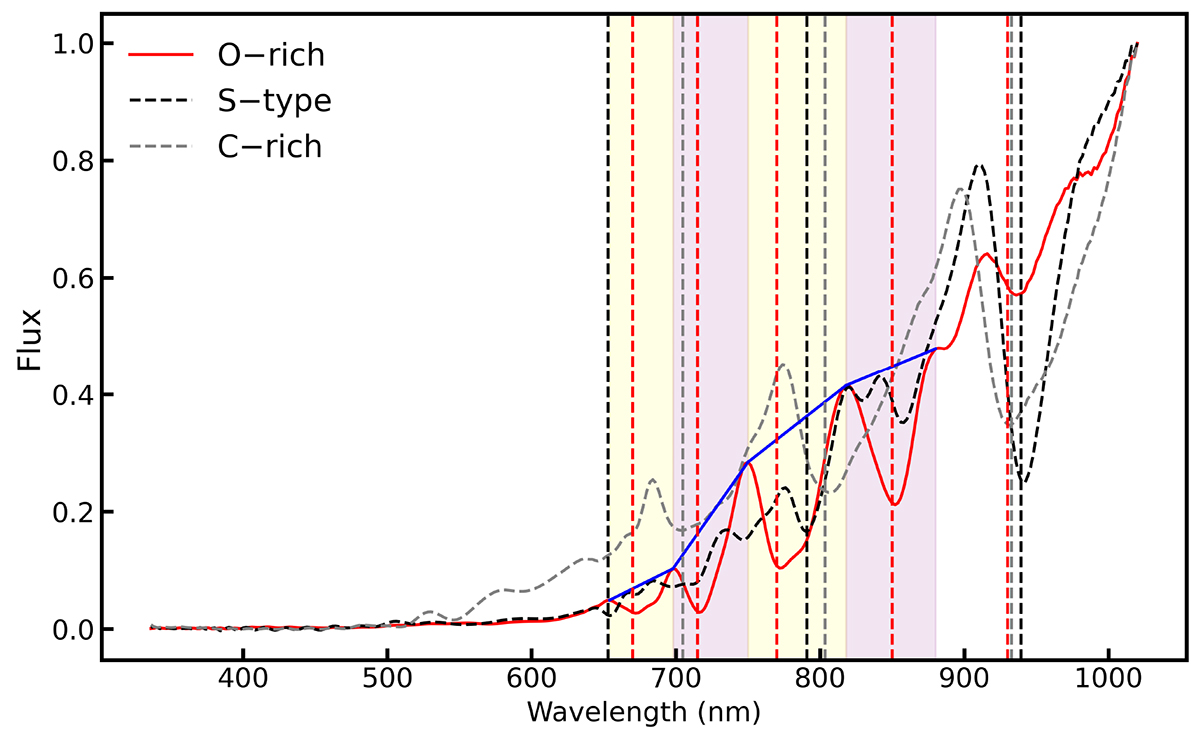
Fig. 6.
Download original image
Examples of three XP spectra of an oxygen-rich star (source_id: 5853243278519978112, solid red line), a carbon-rich star (source_id: 5716487091710504064, dashed gray line), and an S-type star (source_id: 5233074194539855360, dashed black line). The spectra are normalized to the maximum flux for comparison. The shaded color denotes the ranges of the four measured TiO bands. The four solid blue lines represent the pseudo-continuum of measuring equivalent width.
Current usage metrics show cumulative count of Article Views (full-text article views including HTML views, PDF and ePub downloads, according to the available data) and Abstracts Views on Vision4Press platform.
Data correspond to usage on the plateform after 2015. The current usage metrics is available 48-96 hours after online publication and is updated daily on week days.
Initial download of the metrics may take a while.