Fig. 5.
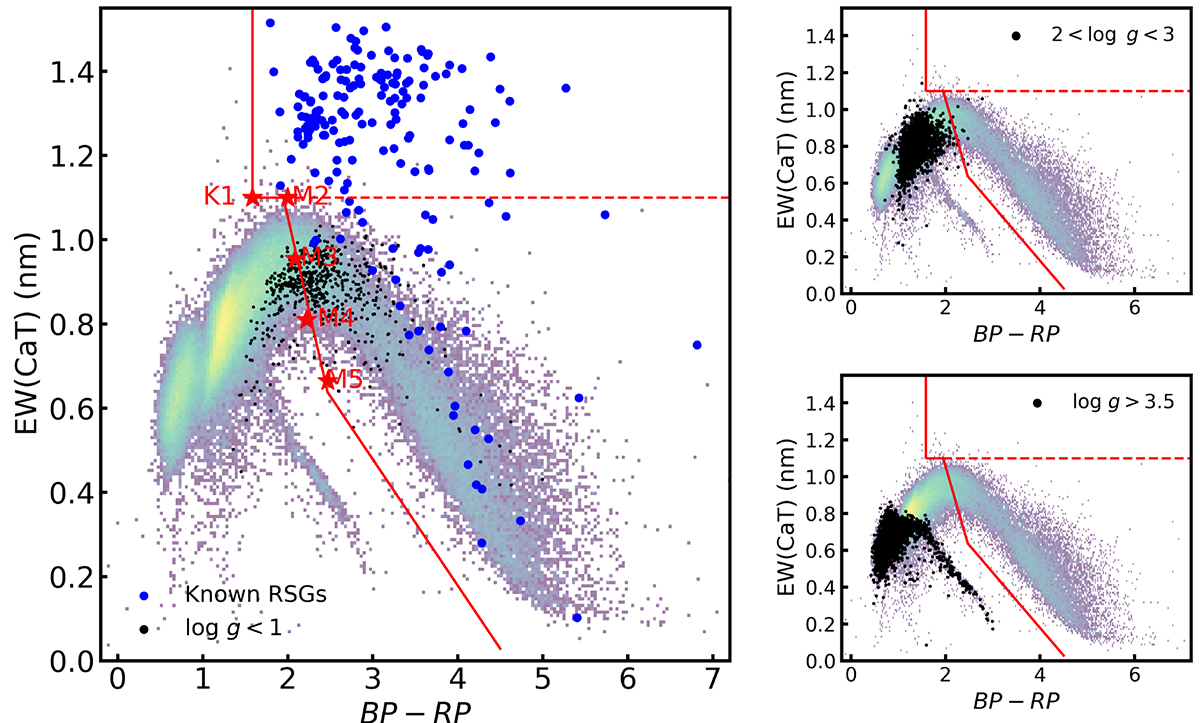
Download original image
EW(CaT) vs. BP − RP color-coded by density for all selected RVS objects. Overlaid black dots are those with APOGEE measurements of log g. They are plotted separately to represent the positions of different types of stars. The blue dots in the left panel are the known Galactic RSGs mentioned in Sect. 3.1.1. The red asterisks mark the positions of zero-extinction K1 and M2-M5 RSGs. The solid red lines represent the bluest boundary of Galactic RSGs in this diagram, while the dashed red line marks the dividing line between the early- and late-type RSGs.
Current usage metrics show cumulative count of Article Views (full-text article views including HTML views, PDF and ePub downloads, according to the available data) and Abstracts Views on Vision4Press platform.
Data correspond to usage on the plateform after 2015. The current usage metrics is available 48-96 hours after online publication and is updated daily on week days.
Initial download of the metrics may take a while.