Open Access
Fig. 2.
Download original image
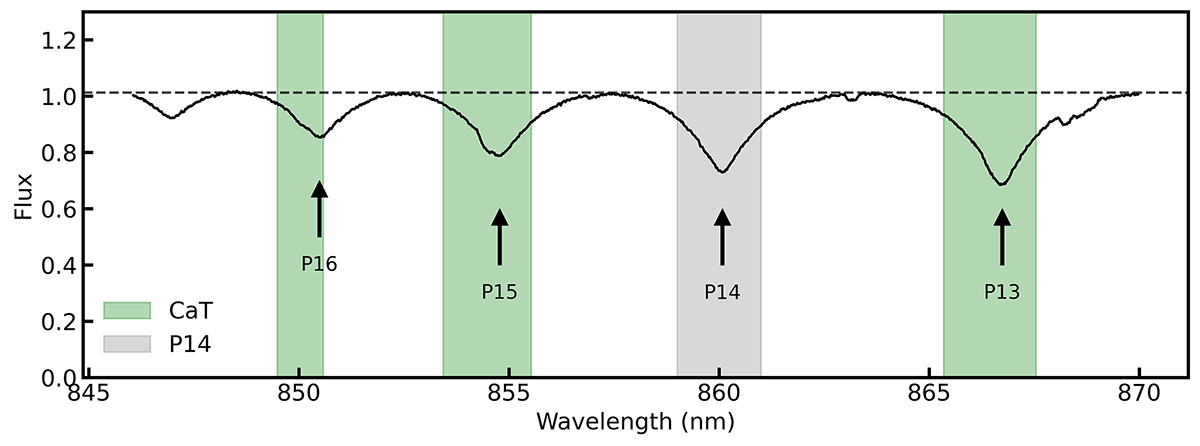
Example of the RVS spectrum of a typical early-type star (source_id: 2270570062017774976). The position indicated by the arrow marks the Paschen line series P13-P16 for hydrogen. The gray and green shade mark the measuring ranges of P14 and CaT, respectively.
Current usage metrics show cumulative count of Article Views (full-text article views including HTML views, PDF and ePub downloads, according to the available data) and Abstracts Views on Vision4Press platform.
Data correspond to usage on the plateform after 2015. The current usage metrics is available 48-96 hours after online publication and is updated daily on week days.
Initial download of the metrics may take a while.