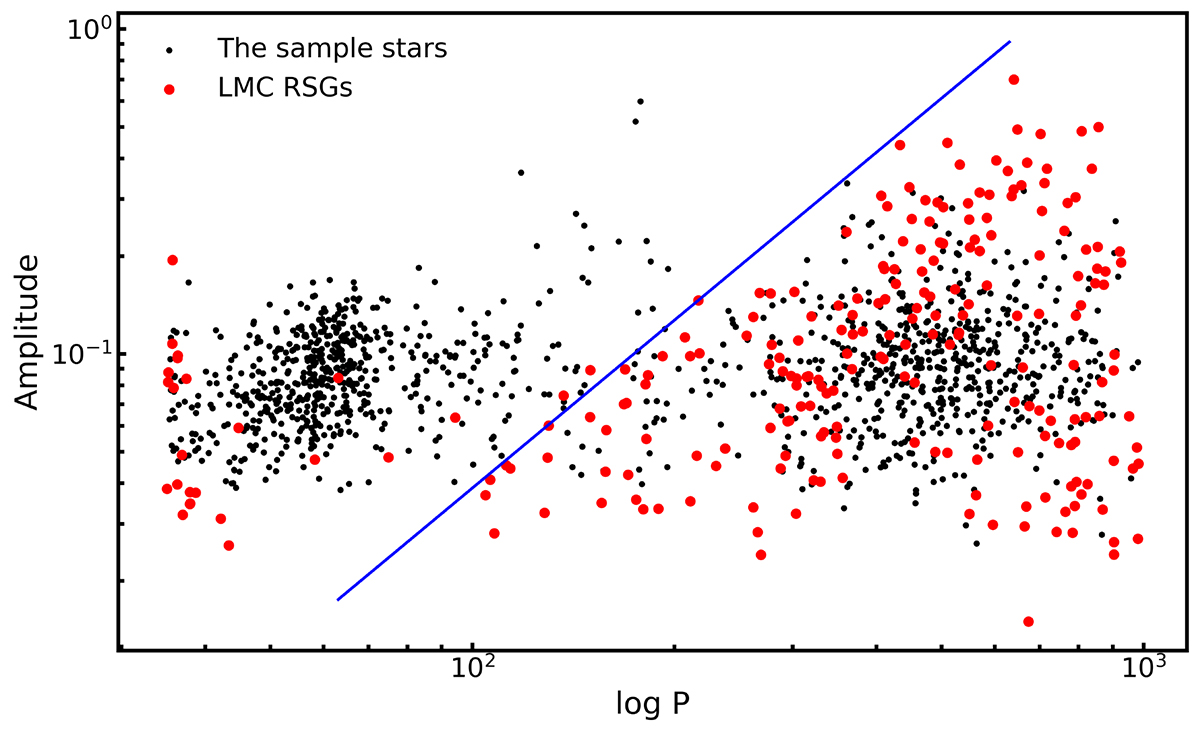
Fig. 12.
Download original image
Period–amplitude diagram of our sample stars (black dots) and the LMC RSGs from Ren et al. (2021b, red dots). The amplitude and period are taken from the Gaia DR3 LPV catalog (Lebzelter et al. 2023). The solid blue lines are manually drawn to separate the AGB star branch (short period) and the RSG candidate branch (long period).
Current usage metrics show cumulative count of Article Views (full-text article views including HTML views, PDF and ePub downloads, according to the available data) and Abstracts Views on Vision4Press platform.
Data correspond to usage on the plateform after 2015. The current usage metrics is available 48-96 hours after online publication and is updated daily on week days.
Initial download of the metrics may take a while.