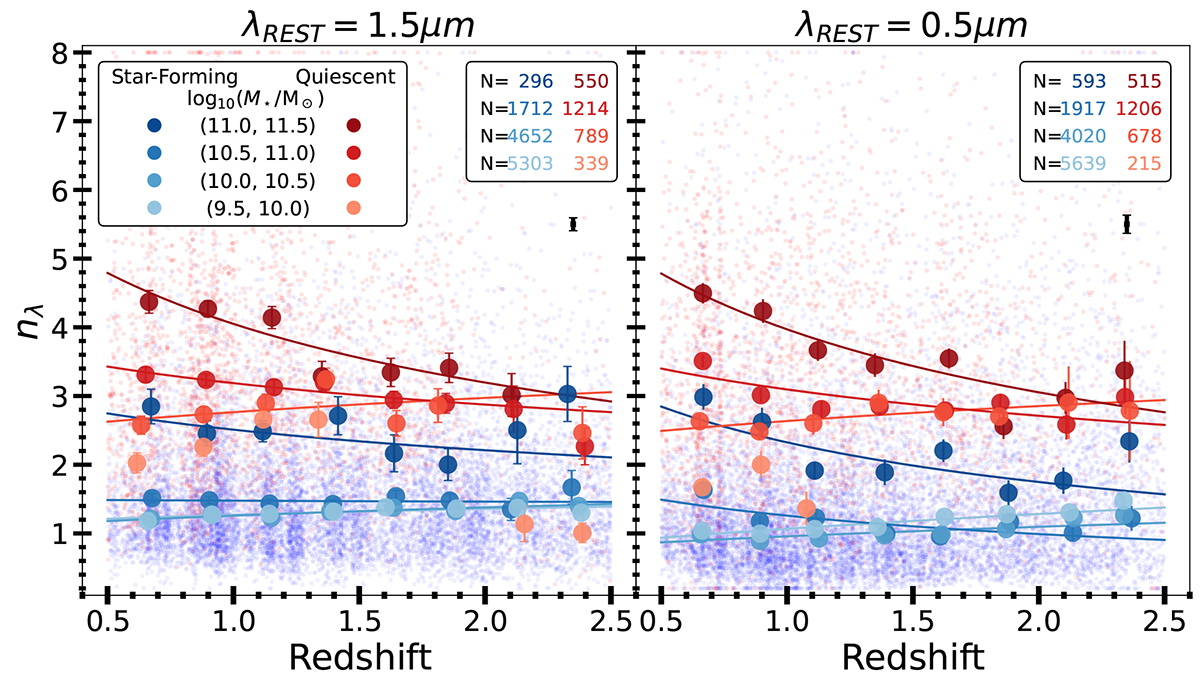
Fig. 7.
Download original image
Same as Figure 2 but medians are now computed separately on the quiescent (reds) and star-forming (blues) samples. Solid lines represent fits to nλ ∝ (1 + z)βλ. Fits to the lowest-mass bin for quiescent galaxies are not shown because considered not robust due to the small sample. In the top right corner, we report the number of galaxies in each stellar-mass bin using the same color coding, and we show the median uncertainty on the Sérsic index as a black error bar. For both populations, nλ mildly evolves with redshift for low-M⋆ galaxies while it does for the ones at high-M⋆.
Current usage metrics show cumulative count of Article Views (full-text article views including HTML views, PDF and ePub downloads, according to the available data) and Abstracts Views on Vision4Press platform.
Data correspond to usage on the plateform after 2015. The current usage metrics is available 48-96 hours after online publication and is updated daily on week days.
Initial download of the metrics may take a while.