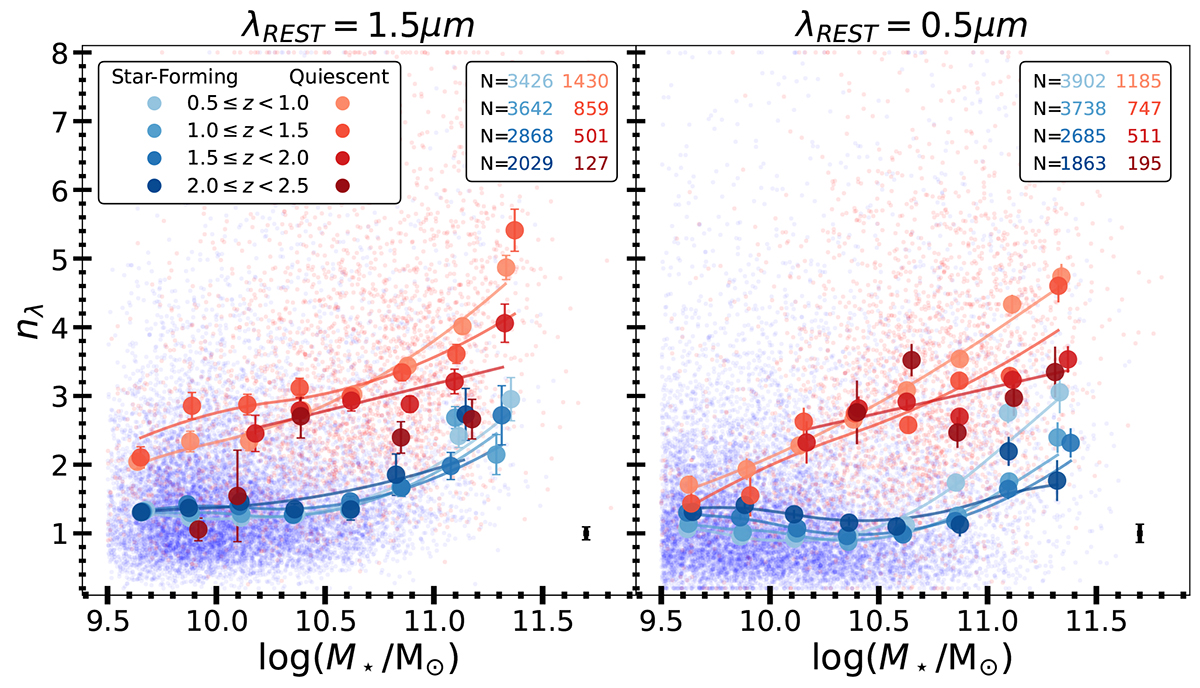
Fig. 6.
Download original image
Same as Figure 1 but medians are now computed separately on the quiescent (reds) and star-forming (blues) samples. Solid lines show spline-quantile regression obtained using the COBS library (Ng & Maechler 2007, 2022). 16-50-84 percentiles of n at each redshift and mass bins are reported in Appendix B. For the quiescent population in the highest redshift bin, just the circles are shown and not the solid line because the spline regression was not robust enough given the low number of samples. The median uncertainty on the Sérsic index is shown in the bottom right corner as a black error bar. We report the number of galaxies in each redshift bin in the top right corner of each panel. nλ evolves with stellar mass for both populations.
Current usage metrics show cumulative count of Article Views (full-text article views including HTML views, PDF and ePub downloads, according to the available data) and Abstracts Views on Vision4Press platform.
Data correspond to usage on the plateform after 2015. The current usage metrics is available 48-96 hours after online publication and is updated daily on week days.
Initial download of the metrics may take a while.