Fig. 4.
Download original image
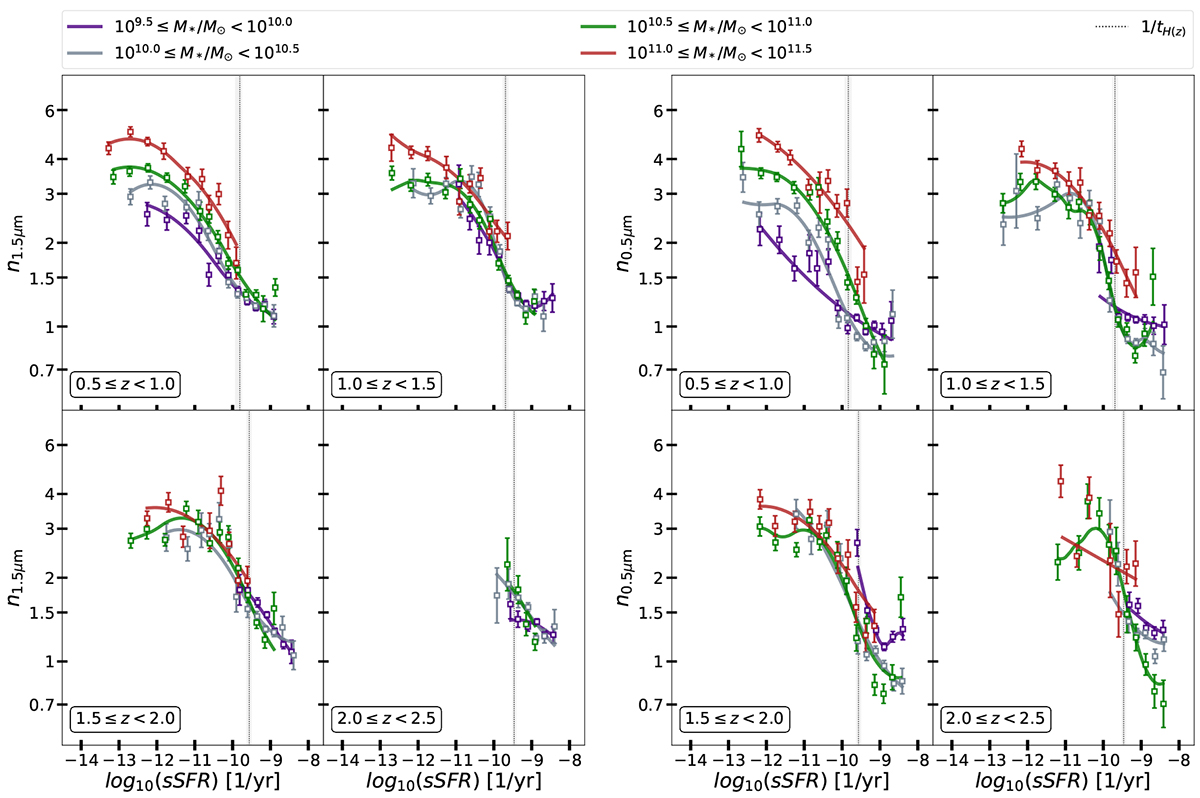
Sérsic index as a function of the specific Star Formation Rate (sSFR) in four redshift bins. Each color represents a stellar mass bin with solid lines showing spline-quantile regression and squares showing the median Sérsic index in sSFR bins. Error bars show the statistical uncertainty on the median (![]() ). We highlight the
). We highlight the ![]() values between the two redshift extremes as a gray-shaded area and as a dotted line the position at the median redshift. Systematic differences in n0.5 μm (left) and n1.5 μm (right) due to stellar mass appear at z ≤ 1 independently on the wavelength observed.
values between the two redshift extremes as a gray-shaded area and as a dotted line the position at the median redshift. Systematic differences in n0.5 μm (left) and n1.5 μm (right) due to stellar mass appear at z ≤ 1 independently on the wavelength observed.
Current usage metrics show cumulative count of Article Views (full-text article views including HTML views, PDF and ePub downloads, according to the available data) and Abstracts Views on Vision4Press platform.
Data correspond to usage on the plateform after 2015. The current usage metrics is available 48-96 hours after online publication and is updated daily on week days.
Initial download of the metrics may take a while.