Fig. 3.
Download original image
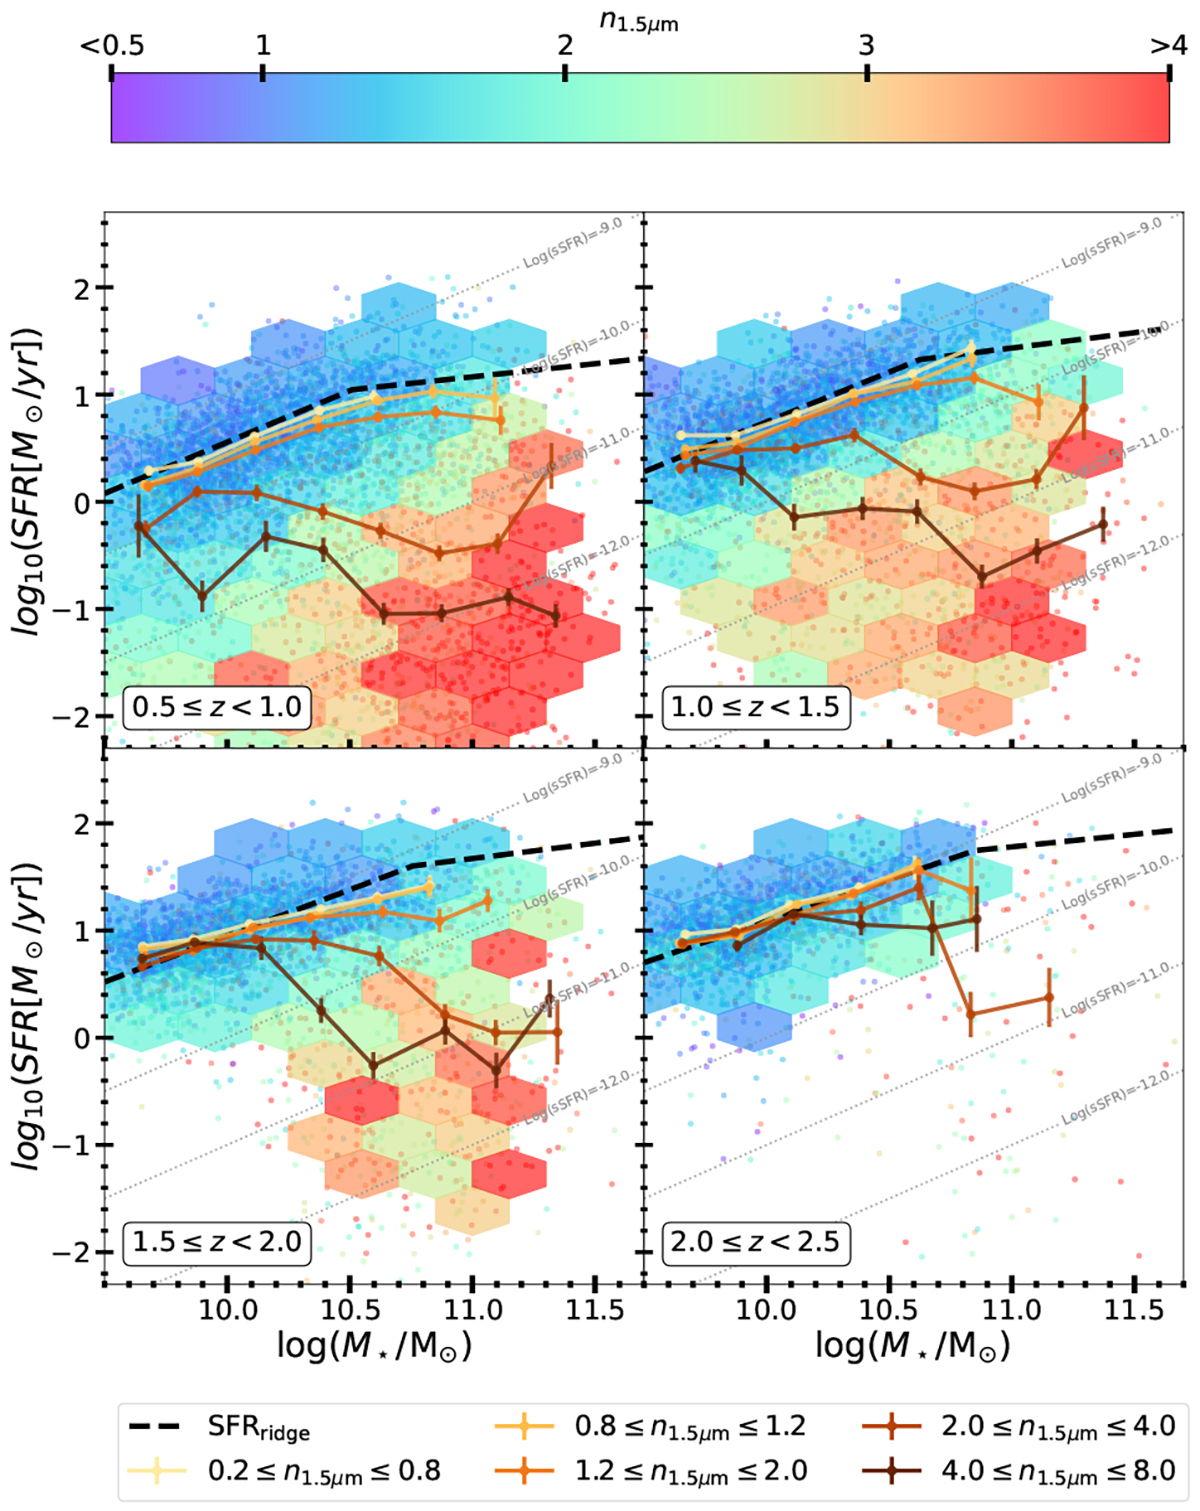
Star-formation rate (SFR) vs. stellar mass in four redshift bins color-coded by n1.5 μm. The dashed black line represents the SFR-ridge identified in Leja et al. (2020). Solid lines show the median trends in five n1.5 μm bins. Hexbins are drawn around groups of at least 10 galaxies and colored with the median n1.5 μm. For reference, constant log(sSFR) lines are shown in light gray. Exponential-like galaxies lay on the SFMS at any redshift and stellar mass. n1.5 μm > 2 galaxies detach from the SFMS at different stellar masses as a function of redshift.
Current usage metrics show cumulative count of Article Views (full-text article views including HTML views, PDF and ePub downloads, according to the available data) and Abstracts Views on Vision4Press platform.
Data correspond to usage on the plateform after 2015. The current usage metrics is available 48-96 hours after online publication and is updated daily on week days.
Initial download of the metrics may take a while.