Fig. 1.
Download original image
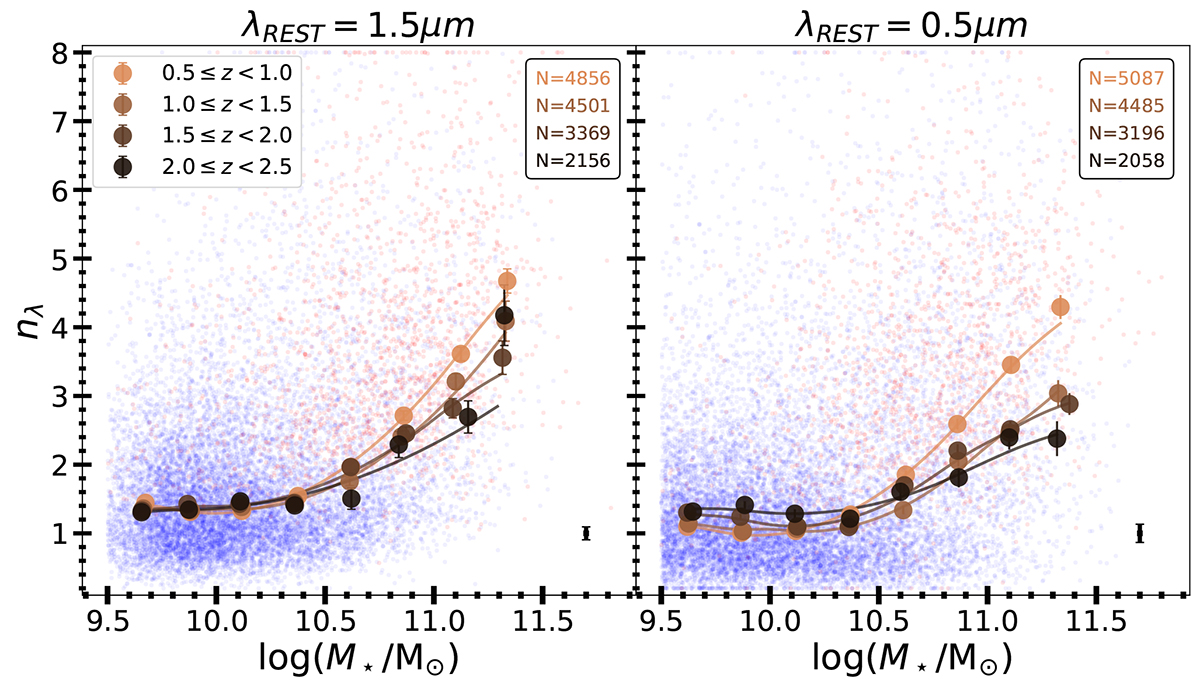
Sérsic index at rest-frame 1.5 μm (left panel) and rest-frame 0.5 μm (right panel) as a function of stellar mass. Dots in the background represent nλ of the individual star-forming (blue) and quiescent (red) galaxies. Filled circles show the median nλ in stellar mass bins of width 0.25 dex and four redshift bins from low-z (light) to high-z (dark). Error bars identify the statistical uncertainties computed as ![]() with N the number of galaxies within the bin and σ the standard deviation of the distribution. Solid lines show spline-quantile regression obtained using the COBS library (Ng & Maechler 2007, 2022). 16-50-84 percentiles of n at each redshift and mass bins are reported in Appendix B. The median uncertainty on the Sérsic index is shown in the bottom right corner as a black error bar. We report the number of galaxies in each redshift bin in the top right corner of each panel. In any redshift bin massive galaxies have higher nλ than at lower mass.
with N the number of galaxies within the bin and σ the standard deviation of the distribution. Solid lines show spline-quantile regression obtained using the COBS library (Ng & Maechler 2007, 2022). 16-50-84 percentiles of n at each redshift and mass bins are reported in Appendix B. The median uncertainty on the Sérsic index is shown in the bottom right corner as a black error bar. We report the number of galaxies in each redshift bin in the top right corner of each panel. In any redshift bin massive galaxies have higher nλ than at lower mass.
Current usage metrics show cumulative count of Article Views (full-text article views including HTML views, PDF and ePub downloads, according to the available data) and Abstracts Views on Vision4Press platform.
Data correspond to usage on the plateform after 2015. The current usage metrics is available 48-96 hours after online publication and is updated daily on week days.
Initial download of the metrics may take a while.