Fig. 5
Download original image
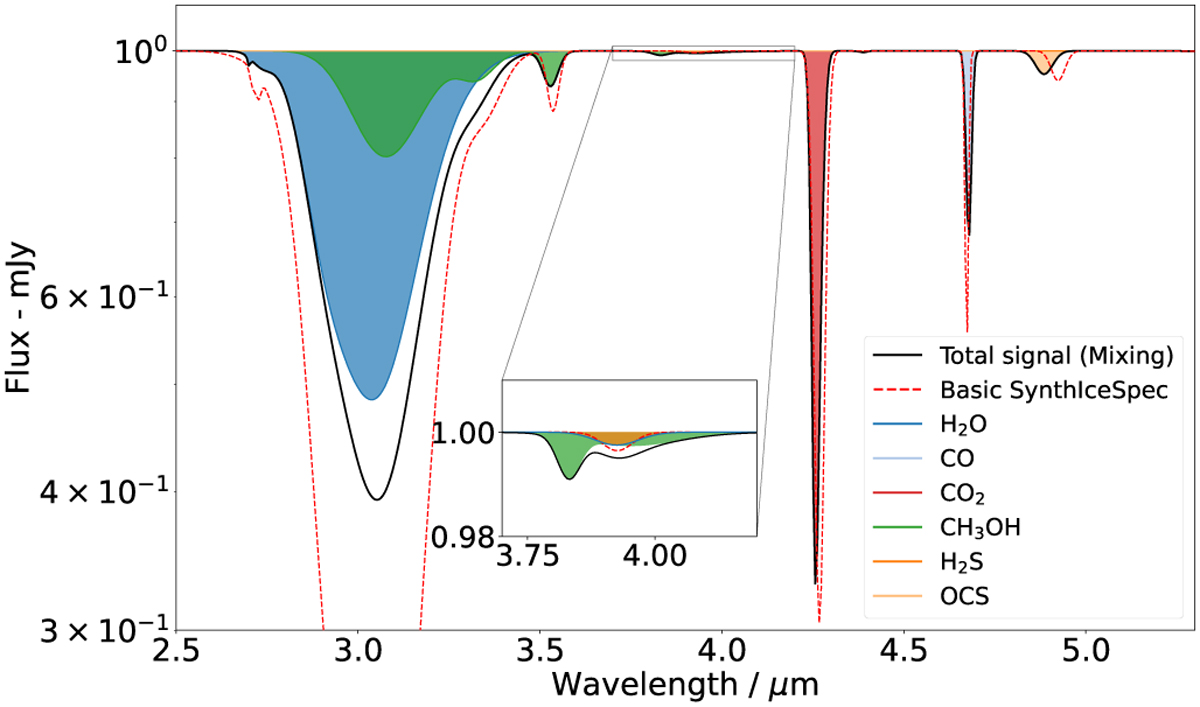
Synthetic ice spectra of a ‘simple’ ice composition, containing only the major ice species and S-bearing molecules in the NIRSpec wavelengths. The spectral information used for each species (band shapes, positions and band strengths) are listed in Table A.1. The column densities of H2O, CO, CO2, CH3OH used to plot these spectra are, respectively, 3.0 × 10¹⁸, 3.0 × 10¹⁷, 3.0 × 10¹⁷, and 5.0 × 10¹⁷ molecules cm−2, while we assume 1.0 × 10¹⁶ molecules cm−2 for all four S-bearing species (H2S, OCS, SO2, and CS2). The zoom panel emphasises the low band strength of the band corresponding to H2S, as well as its overlapping with the methanol combination mode. The red line is the signal that would be obtained with the most basic settings in SynthIceSpec (pure species with no mixing). In this wavelength range, of the S-bearing species, only OCS and H2S present absorption features.
Current usage metrics show cumulative count of Article Views (full-text article views including HTML views, PDF and ePub downloads, according to the available data) and Abstracts Views on Vision4Press platform.
Data correspond to usage on the plateform after 2015. The current usage metrics is available 48-96 hours after online publication and is updated daily on week days.
Initial download of the metrics may take a while.