Fig. 4
Download original image
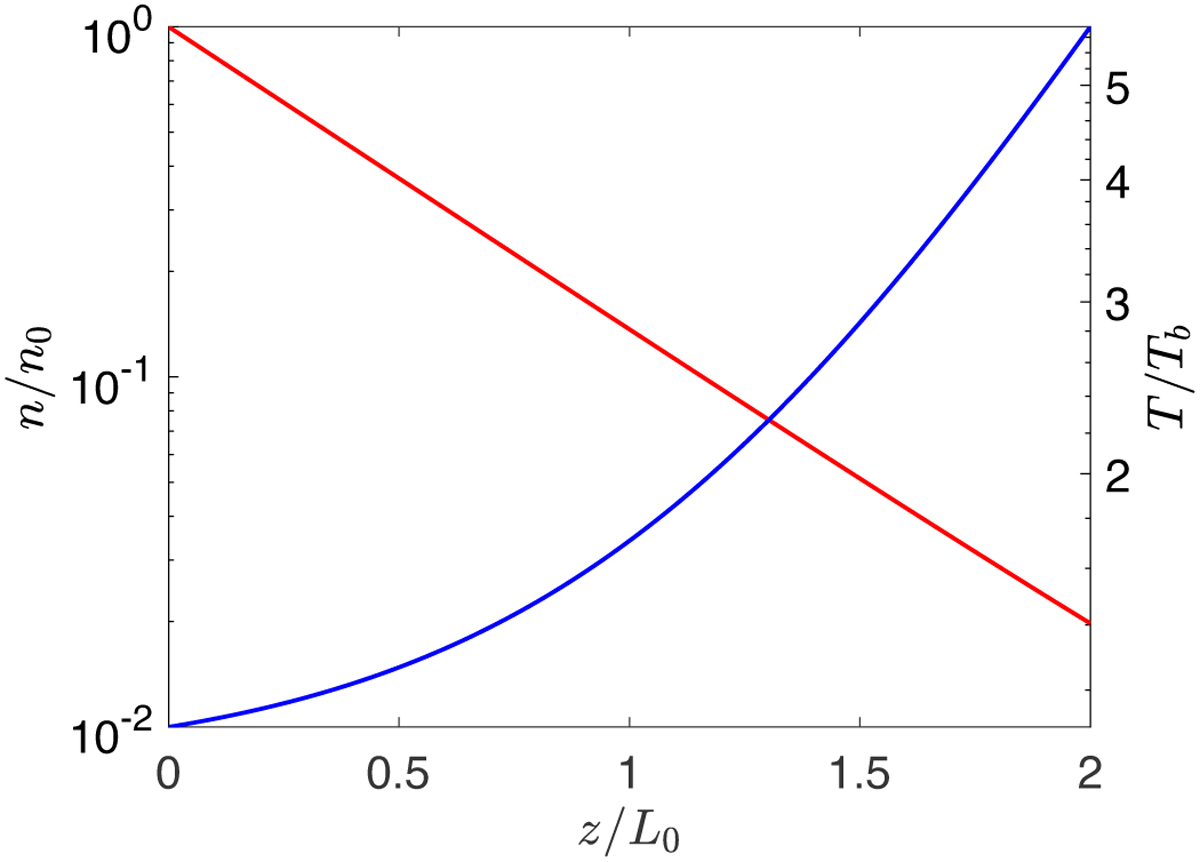
Temperature and density profiles as in Fig. 3, obtained using ![]() and
and ![]() . This is an example of a situation in which the model does not predict a Sun-like corona: there is temperature inversion, but the temperature reached at the top of the loop is much smaller than typical coronal temperatures and there is no steep rise in temperature, since both density and temperature gently vary with ɀ.
. This is an example of a situation in which the model does not predict a Sun-like corona: there is temperature inversion, but the temperature reached at the top of the loop is much smaller than typical coronal temperatures and there is no steep rise in temperature, since both density and temperature gently vary with ɀ.
Current usage metrics show cumulative count of Article Views (full-text article views including HTML views, PDF and ePub downloads, according to the available data) and Abstracts Views on Vision4Press platform.
Data correspond to usage on the plateform after 2015. The current usage metrics is available 48-96 hours after online publication and is updated daily on week days.
Initial download of the metrics may take a while.