Fig. 3
Download original image
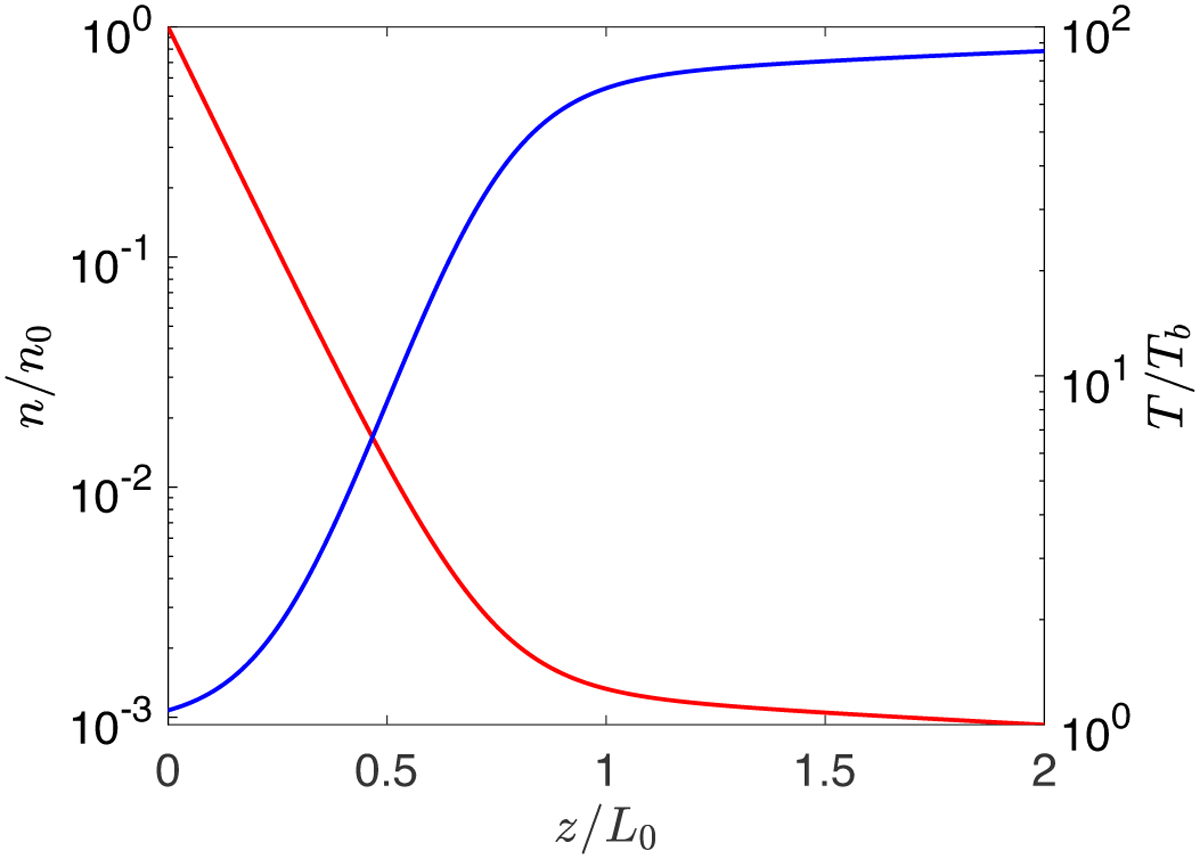
Temperature and density profiles as a function of the dimensionless height ɀ/L0 within the loop obtained using ![]() and
and ![]() . Temperature (blue curve) is plotted in units of Tb, while density (red curve) is plotted in units of the density at the base of the loop, n0 = n(ɀ = 0). This is an example of Sun-like coronal profiles: for small values of ɀ there is a steep rise in T (resp. steep fall in n), at the end of which the values of n and T are already coronal ones, while for larger ɀ’s T increases (resp. n decreases) in a much gentler way.
. Temperature (blue curve) is plotted in units of Tb, while density (red curve) is plotted in units of the density at the base of the loop, n0 = n(ɀ = 0). This is an example of Sun-like coronal profiles: for small values of ɀ there is a steep rise in T (resp. steep fall in n), at the end of which the values of n and T are already coronal ones, while for larger ɀ’s T increases (resp. n decreases) in a much gentler way.
Current usage metrics show cumulative count of Article Views (full-text article views including HTML views, PDF and ePub downloads, according to the available data) and Abstracts Views on Vision4Press platform.
Data correspond to usage on the plateform after 2015. The current usage metrics is available 48-96 hours after online publication and is updated daily on week days.
Initial download of the metrics may take a while.