Open Access
Fig. 2
Download original image
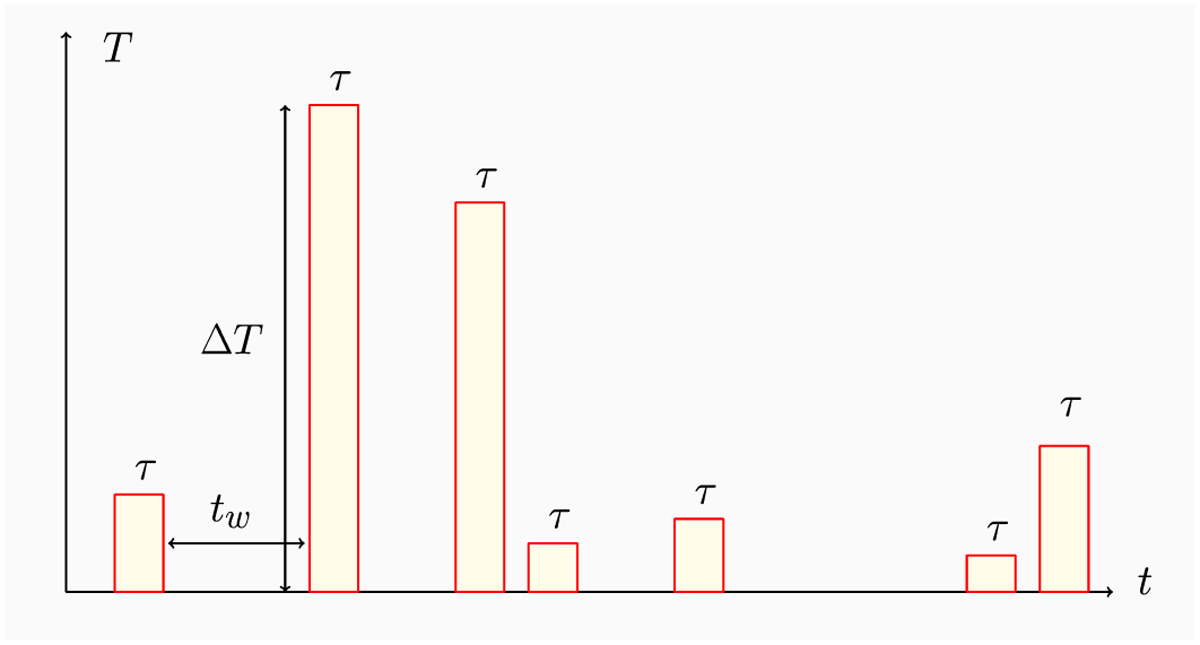
Sketch of the time series of the temperature of the thermostat (chromosphere). During the time intervals of duration τ the temperature increases by an amount ΔT and during the waiting times tw it returns to the typical chromospheric value Tb.
Current usage metrics show cumulative count of Article Views (full-text article views including HTML views, PDF and ePub downloads, according to the available data) and Abstracts Views on Vision4Press platform.
Data correspond to usage on the plateform after 2015. The current usage metrics is available 48-96 hours after online publication and is updated daily on week days.
Initial download of the metrics may take a while.