Fig. A.4
Download original image
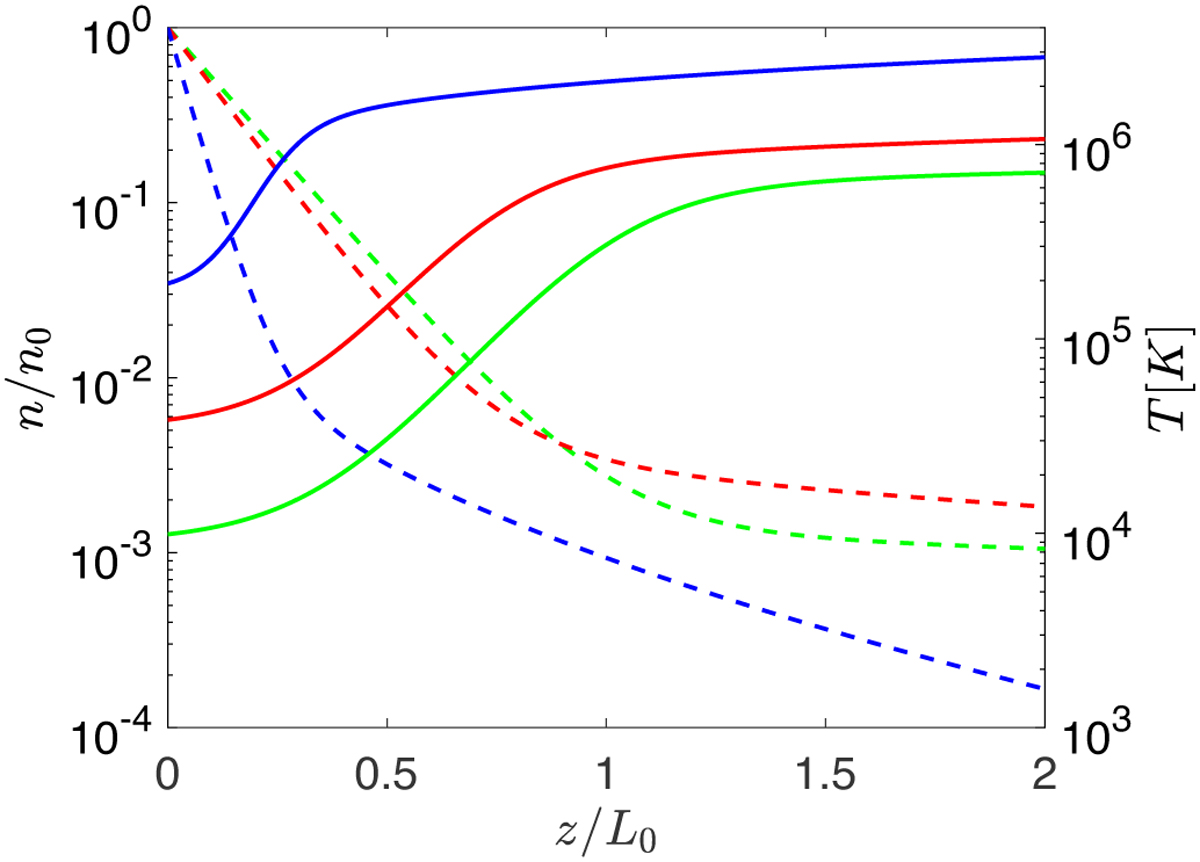
Density n (in units of the density at the base of the loop, n0 = n(z = 0)) and temperature T (in Kelvin) as a function of the height z within the loop, scaled by L0 = L/π (where 2L is the loop length), for some values of the mass in the range 1.5 < M/M⊙ < 31. As in Fig. 9, here we choose zt/R = 1/35, such that X > 0.9 for all the values of M and there always is a Sun-like corona. Solid lines correspond to temperatures and dashed lines to densities. The green curves are computed for M = 2 M⊙, the red ones for M = 7 M⊙, the blue ones for M = 25 M⊙.
Current usage metrics show cumulative count of Article Views (full-text article views including HTML views, PDF and ePub downloads, according to the available data) and Abstracts Views on Vision4Press platform.
Data correspond to usage on the plateform after 2015. The current usage metrics is available 48-96 hours after online publication and is updated daily on week days.
Initial download of the metrics may take a while.