Fig. 11
Download original image
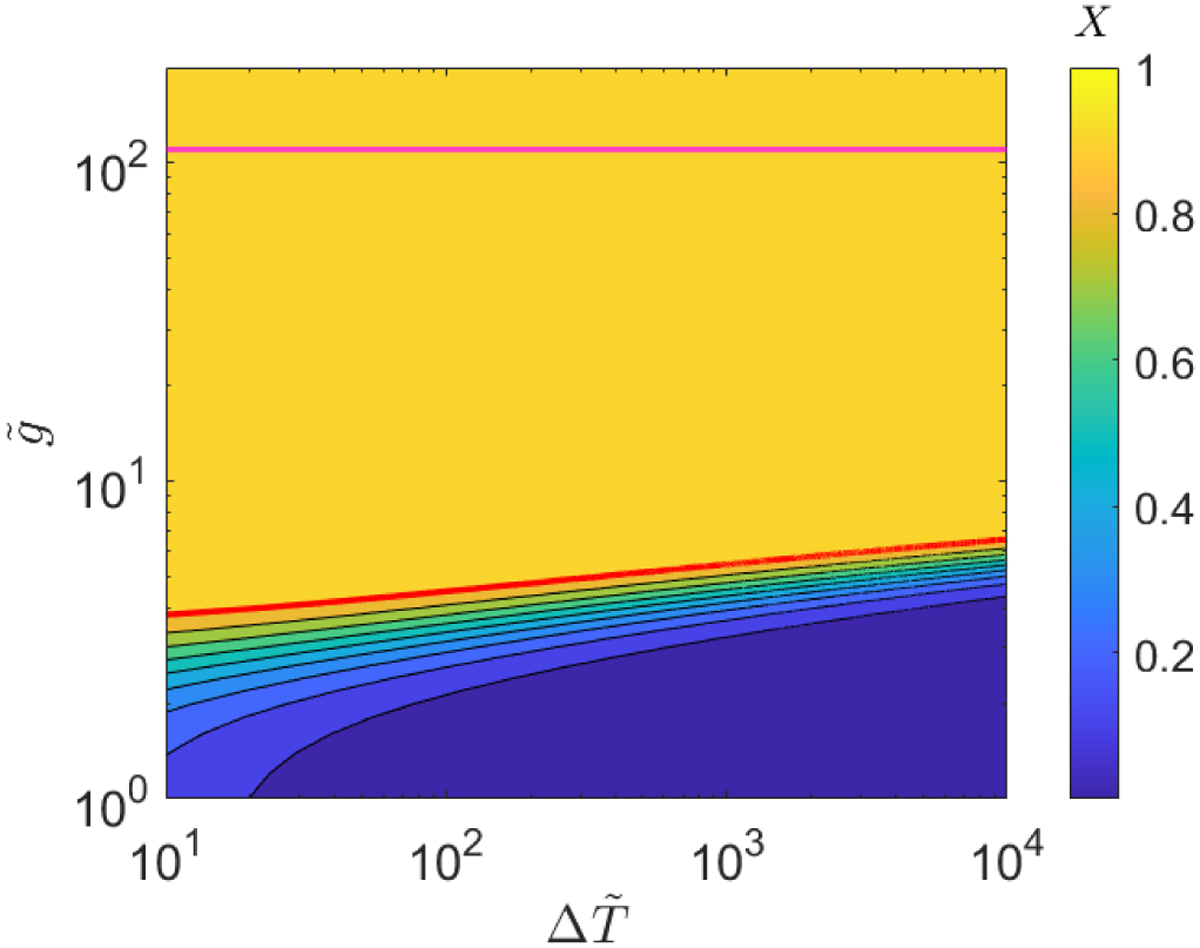
Contour plot of X computed using Eq. (12) as a function of the dimensionless intensity of the temperature increments ![]() and of the stratification parameter
and of the stratification parameter ![]() . The red solid line corresponds to the threshold value X = 0.9 separating the region of parameters in which the model predicts a Sun-like steep increase of temperature and ahot corona (X > 0.9, yellowish colours) from that where it does not (X < 0.9, bluish colours). The magenta horizontal line is the maximum value of
. The red solid line corresponds to the threshold value X = 0.9 separating the region of parameters in which the model predicts a Sun-like steep increase of temperature and ahot corona (X > 0.9, yellowish colours) from that where it does not (X < 0.9, bluish colours). The magenta horizontal line is the maximum value of ![]() as a function of M.
as a function of M.
Current usage metrics show cumulative count of Article Views (full-text article views including HTML views, PDF and ePub downloads, according to the available data) and Abstracts Views on Vision4Press platform.
Data correspond to usage on the plateform after 2015. The current usage metrics is available 48-96 hours after online publication and is updated daily on week days.
Initial download of the metrics may take a while.