Fig. 10
Download original image
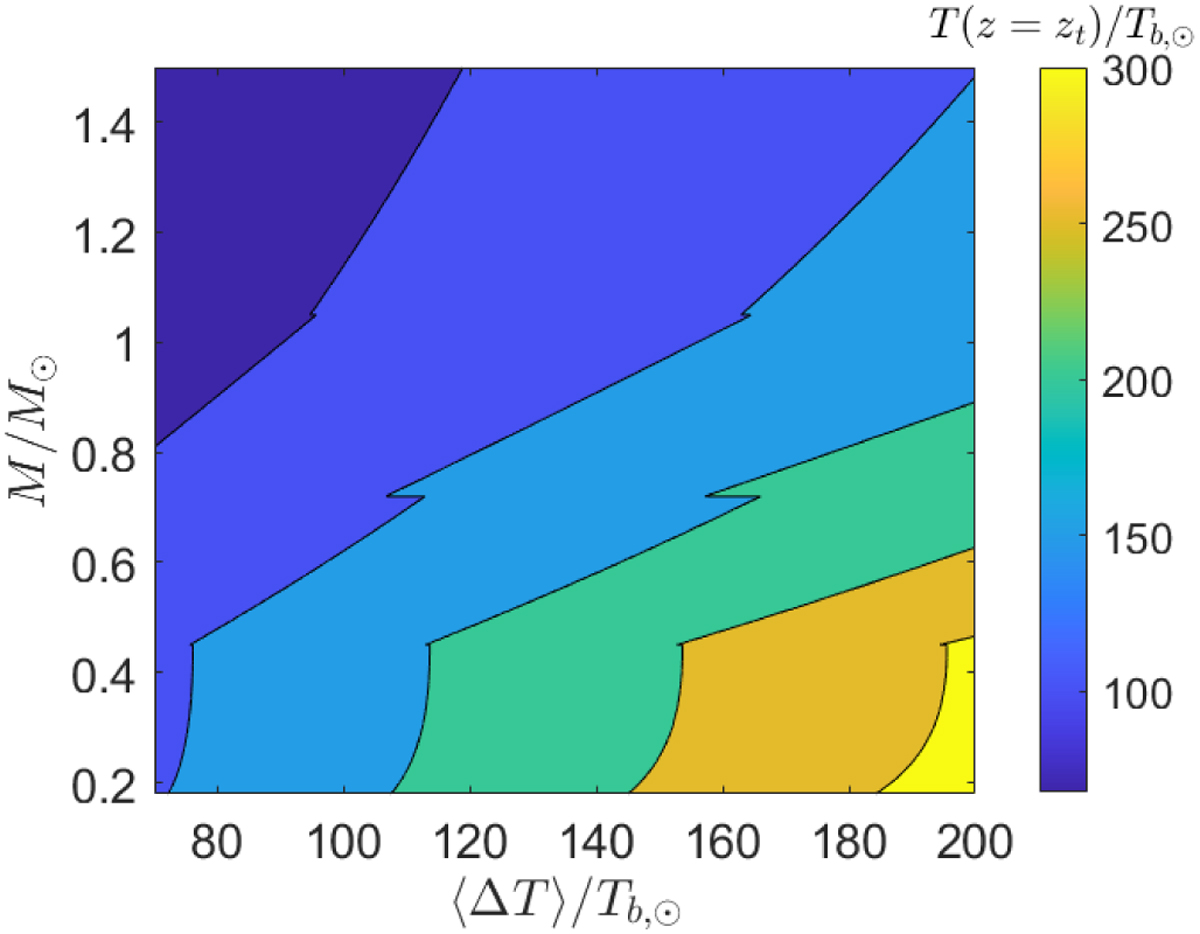
Contour plot of the temperature at the top of the loop T(z = zt) scaled by the chromospheric temperature of the Sun Tb,⊙ = 104K as a function of the dimensionless intensity of the temperature increments ∆T scaled by the chromospheric temperature of the Sun Tb,⊙ and of the star mass scaled by the Sun mass M/M⊙. The range of ∆T goes from 70Tb,⊙ smaller than 90Tb,⊙ (that is the value used in the case of the Sun) up to 200Tb,⊙ larger than the value used for the Sun. For the ratio zt/R we have used 1/35 that is the same value used in the previous section.
Current usage metrics show cumulative count of Article Views (full-text article views including HTML views, PDF and ePub downloads, according to the available data) and Abstracts Views on Vision4Press platform.
Data correspond to usage on the plateform after 2015. The current usage metrics is available 48-96 hours after online publication and is updated daily on week days.
Initial download of the metrics may take a while.