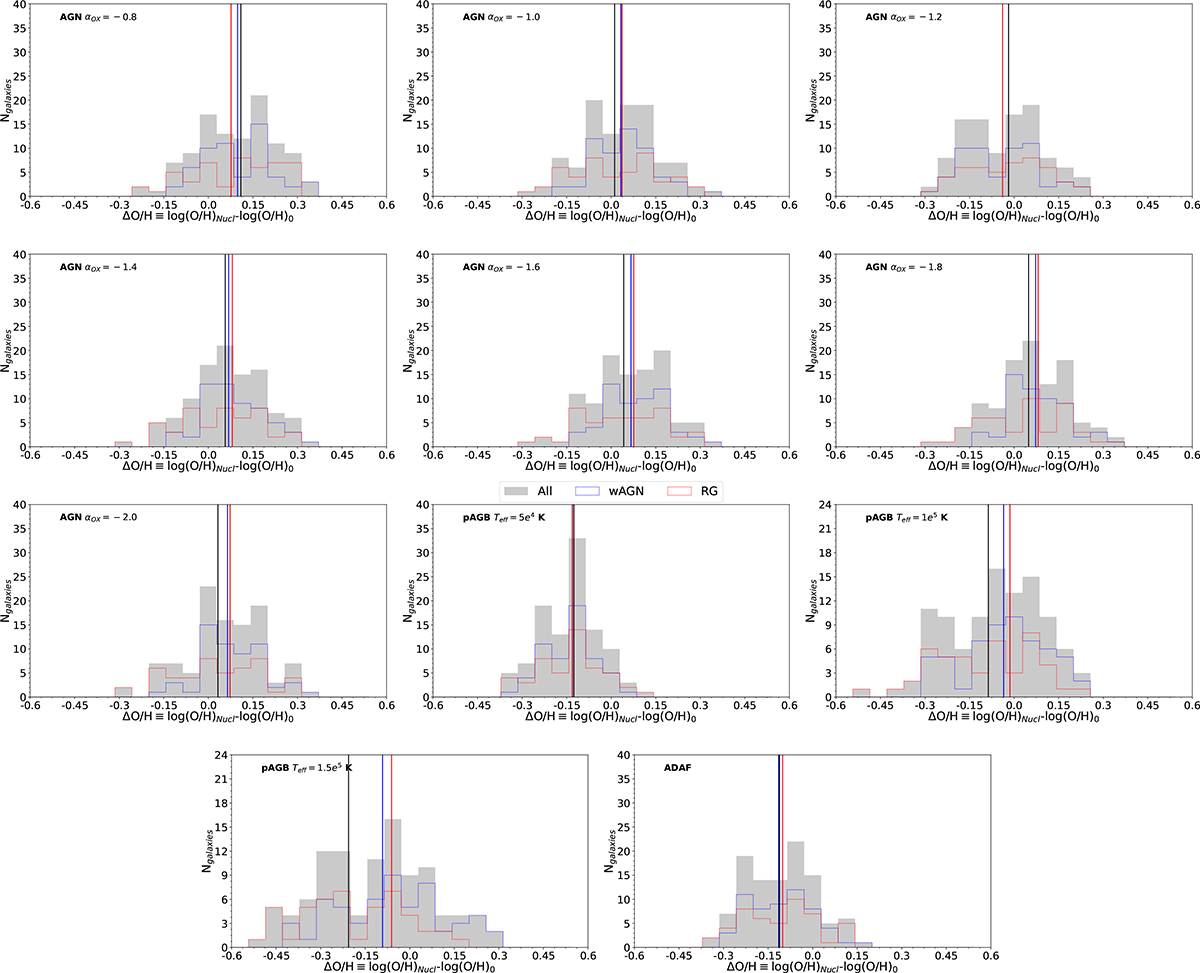
Fig. 8.
Download original image
Histograms of the difference between 12+log(O/H)Nucl as estimated in the central regions using different photoionization models and 12+log(O/H)0, as extrapolated from metallicity gradients. The step-filled gray histogram corresponds to all LINERs in our sample. The step blue and red histograms correspond to wAGNs and RGs, respectively. The vertical solid lines represent the median values for each distribution.
Current usage metrics show cumulative count of Article Views (full-text article views including HTML views, PDF and ePub downloads, according to the available data) and Abstracts Views on Vision4Press platform.
Data correspond to usage on the plateform after 2015. The current usage metrics is available 48-96 hours after online publication and is updated daily on week days.
Initial download of the metrics may take a while.